


Bitcoin (BTC) has entered a relatively mature stage of the market, while traditional markets are facing headwinds and volatility. For the past month, BTC price moves almost matched those of S&P 500.
Bitcoin (BTC) matched the volatility of stock markets, tracking the moves of the S&P 500. The leading crypto coin has a volatility index of 2.7%, the highest in the past six months. Despite this, BTC is still relatively stable compared to previous bull cycles.
The S&P 500 recovered to 5,679.38 points, while BTC jumped to $87,102.13, once again preserving the same direction and bounce from recent lows. The stock index and the leading crypto coin are also waiting the result of US President Donald Trump’s speech on tariffs during the long-awaited ‘Liberation day’.
For the whole month of March, the BTC and S&P 500 charts tracked each other closely while the market paid attention to macro news, geopolitical instability and the US tariffs narrative. BTC was also slightly more stable compared to the Dow Jones index.
The leading crypto coin also tracked the slightly negative direction of the US dollar against other major currencies. BTC remains highly dollarized and exposed to the US market and has also become a proxy for the US economy. BTC is also tracked as a potential indicator for the stock market’s recovery, as an asset that can react much faster and signal bullish enthusiasm.
Another potential scenario is for both BTC and stock indexes to remain range-bound in the medium turn, with no clear direction due to overall global uncertainty.
BTC tracks the stock market, with periods of exaggerated price moves
BTC had an average intraday move of 0.27% in March, based on the change from open to close during US trading hours. This performance matched the volatility of the S&P 500 during the same period. The stock index responded to multiple narratives, including the potential for US tariffs to be imposed on multiple imports.
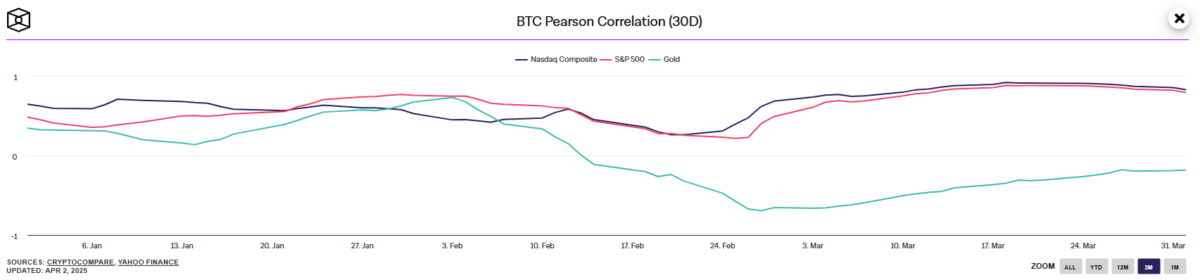
Over a longer time frame, BTC has moved through periods of divergence against the S&P 500. In the short term, BTC has matched the movements of stock indexes, especially during periods of instability. The BTC correlation to US stock indexes increased to 0.7%, showing BTC was not an exact counter-trade and a safe haven, but offered unexpected price moves and higher potential upside.
BTC has achieved much more dramatic gains in the post-election narrative arc, adding 60% to its price, while the S&P500 only grew by 7% after November 2024. Since January 20, BTC is down by 22%, while the stock index slid by 9%. BTC also slowed it has a relatively smaller downside compared to stock investments.
Over the past decade, BTC has benefitted from the same factors as the stock market. The leading coin, however, had more than 10X the growth of the stock index, which added 77% in the past decade. At the same time, BTC expanded by over 600%, not counting its previous rally from extremely low prices.
Ethereum (ETH) and altcoins have decoupled with a larger downside. ETH was down by 18.4% in March, losing a total of 45.3% in Q1.
BTC trades decoupled from gold
Despite talk of a US crypto reserve and ongoing whale accumulation, BTC acts as a proxy for the stock market, not as an independent reserve asset.
One BTC can now buy 26 ounces of gold, down from 37 ounces at the end of 2024.
The BTC price reflects the inflow of mainstream investors, who also follow the logic of the expanding stock market and the overall economy. For now, BTC is seen as an amplified stock bet instead of a store of value.
BTC ETF returned to three days of relatively small outflows after more than a week of net inflows. ETF and new investment products remain relatively attractive for mainstream investors.
Cryptopolitan Academy: Want to grow your money in 2025? Learn how to do it with DeFi in our upcoming webclass. Save Your Spot


No comments yet