


In the world of Bitcoin investment, advancing from an ordinary player to a seasoned expert requires more than just intuition and luck. Let's dive into the 5 critical monitoring dimensions every Bitcoin pro must master - from candlestick charts to on-chain analytics - to strengthen your investment strategies.
1. Candlestick Chart Analysis
Candlestick charts remain the most fundamental yet crucial tool in crypto investment. Like a navigational map, they visually display Bitcoin's price movements across different timeframes. Each candlestick reveals four key data points: opening price, closing price, highest price, and lowest price - essentially telling the story of market sentiment during that period.
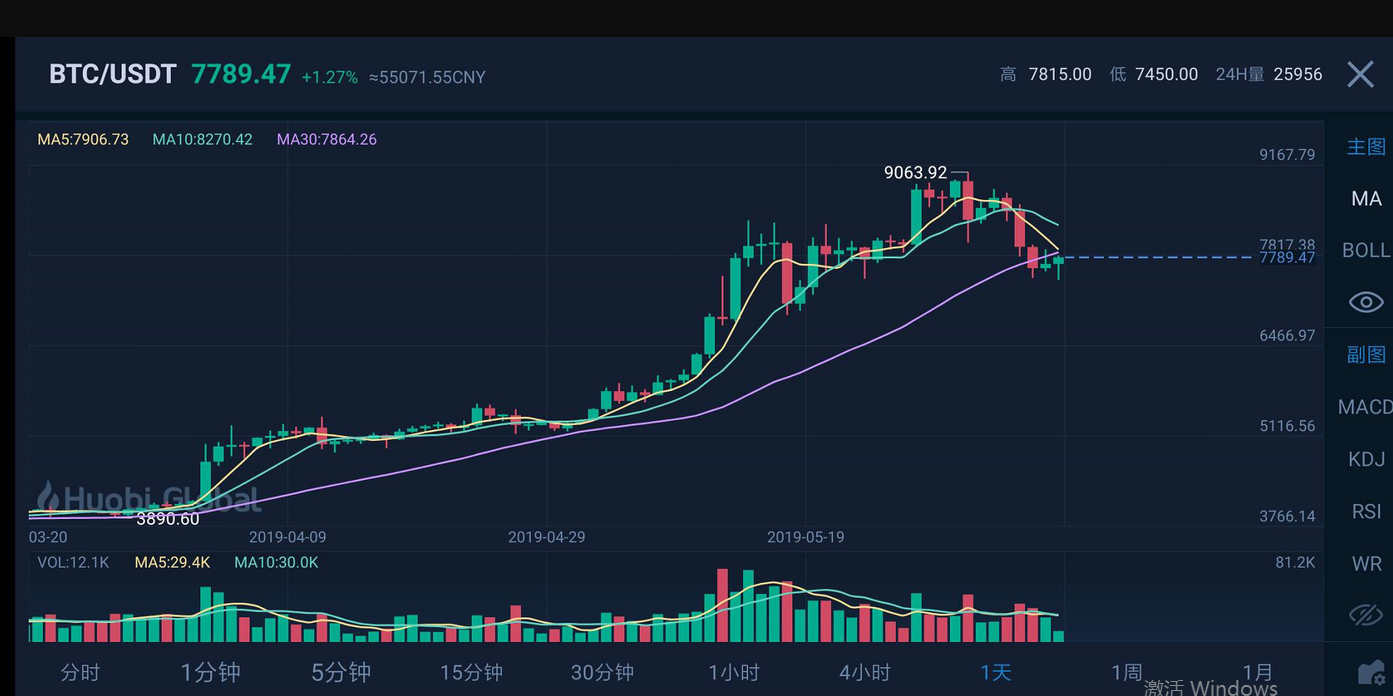
• Bullish vs. Bearish Signals: A green (bullish) candle indicates buyer dominance, while a red (bearish) one shows seller control. The body size reflects the intensity of this battle - a large body suggests decisive market moves.
• Shadow Analysis: Long upper shadows signal strong resistance levels, whereas extended lower shadows indicate solid support zones.
• Pattern Recognition: Classic formations like "Head & Shoulders" (bearish reversal) and "Double Bottom" (bullish reversal) provide actionable insights. However, remember these reflect historical data and should be combined with other indicators.
2. Trading Volume Analysis
Trading volume acts as the market's "thermometer," measuring investor participation and sentiment intensity:
• High Volume + Price Rise: Confirms strong bullish momentum (e.g., breaking resistance levels).
• High Volume + Price Drop: Signals capitulation events or institutional sell-offs.
• Low Volume: Often precedes consolidation phases or trend reversals. Notably, volume validates candlestick patterns - a breakout with low volume is statistically weaker.
3. Open Interest Dynamics
In derivatives markets, open interest (OI) - the number of outstanding contracts - reveals capital flows and positioning:
• OI Increase + Price Rise: Indicates new long positions entering, suggesting sustained upside.
• OI Increase + Price Decline: Shows aggressive shorting activity.
• OI Decrease: Signals profit-taking or position unwinding, often preceding trend exhaustion. Advanced traders monitor OI across exchanges like CME and Binance Futures for institutional clues.
4. On-Chain Data Surveillance
Blockchain analytics provide ground-truth insights into network fundamentals:
• Network Activity: Metrics like active addresses (1.07M daily) and transfer count reflect real adoption. Spikes in whale transactions (>100 BTC) often precede volatility.
• Mining Metrics: Hash rate (current: 580 EH/s) and difficulty adjustments indicate network security and miner confidence. A rising hash rate despite price drops suggests accumulation phases.
• Exchange Flows: Monitoring exchange reserves helps identify accumulation/distribution patterns. For instance, declining Coinbase reserves since 2023 suggest long-term holding.
5. Macroeconomic & Regulatory Monitoring
Bitcoin's evolution as a macro asset demands awareness of:
• Monetary Policy: Fed rate decisions and balance sheet changes impact risk assets. The 2024 dollar index (DXY) inverse correlation remains significant.
• Inflation Hedging: During 2022's 8%+ US inflation, Bitcoin's 60% drawdown challenged but didn't negate its store-of-value narrative.
• Regulatory Shifts: Key developments like the EU's MiCA framework and US spot ETF approvals (2024) dramatically alter market structure.

Strategic Integration Example
When Bitcoin tested $60,000 support in Q3 2024:
Candlesticks showed multiple hammer formations
Volume surged 40% above 30-day average
OI increased by $2B despite price stagnation
Miner outflow ratio dropped to 0.5 (accumulation signal)
Fed paused rate hikes, weakening DXY
This multi-dimensional confirmation preceded a 28% rally to $77,000.
Conclusion
Mastering these dimensions creates a robust analytical framework. While no indicator is infallible, their convergence significantly improves decision-making accuracy. Remember to:
Cross-verify signals across dimensions
Track leading exchanges like Binance and OKX for real-time data
Utilize analytics platforms (Glassnode, CryptoQuant) for deeper insights.
The Bitcoin market rewards those who combine technical rigor with macro awareness. Stay curious, stay verified!


No comments yet