


In the crypto world full of opportunities and challenges, accurately analyzing Bitcoin's price movements is like finding a guiding lighthouse in the vast ocean. Today, I'll introduce you to an incredibly useful tool - Fibonacci retracement - and show you how to apply it on TradingView for Bitcoin price analysis.
What is Fibonacci Retracement?
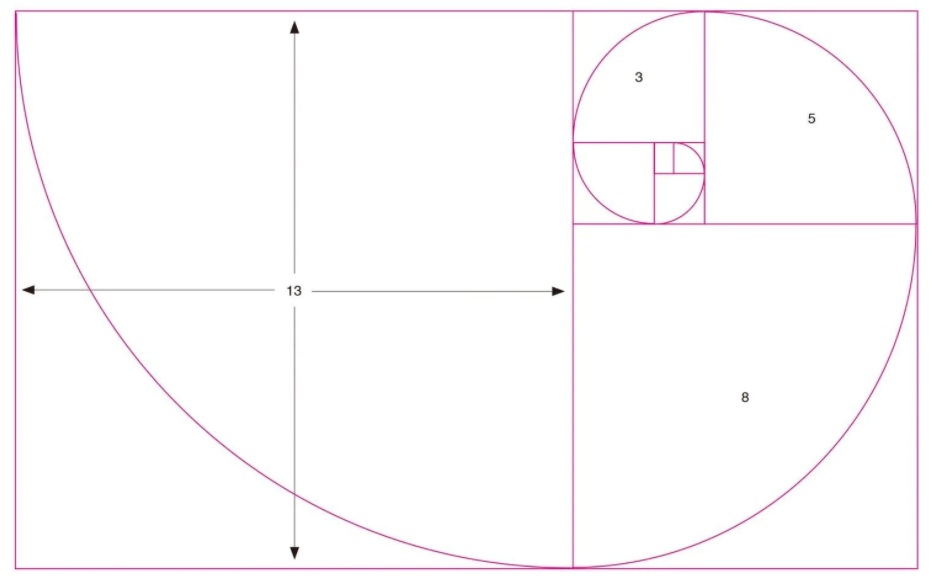
Before we dive into analysis, let's understand what Fibonacci retracement actually is. Derived from mathematics, the Fibonacci ratio (approximately 0.618) is considered the most aesthetically pleasing and harmonious proportion, widely applied in nature and art. In financial markets, Fibonacci retracement plays an equally important role.
When we plot Fibonacci retracement levels on Bitcoin's price chart, it helps identify potential support and resistance levels. Support acts like a "floor" where prices tend to bounce back upward, while resistance serves as a "ceiling" where prices often face downward pressure. These Fibonacci levels help traders anticipate key price points for better decision-making.
How to Draw Fibonacci Retracement on TradingView
Let's walk through the steps to plot Fibonacci retracement on TradingView:
Open TradingView and load Bitcoin's price chart. You can choose different timeframes (daily, weekly, or hourly charts) depending on your trading style.
Locate the drawing tools. On TradingView's interface, find the toolbar containing various drawing tools. The Fibonacci retracement tool typically appears as a line segment with percentage markers.
Identify swing points. For an uptrend, click at the significant low and drag to the peak; for a downtrend, start at the high and drag to the trough. Release to complete the Fibonacci grid.
Applying Fibonacci Retracement to Bitcoin Analysis
1. Identifying Support and Resistance
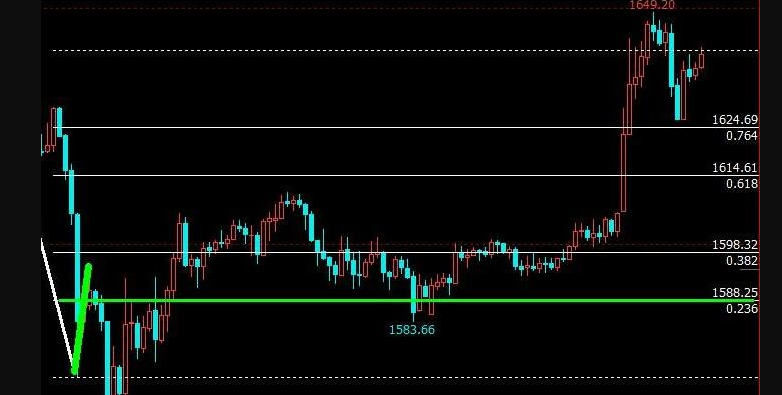
The Fibonacci retracement tool displays horizontal lines at key percentages: 23.6%, 38.2%, 50%, 61.8%, and 78.6%.
23.6% and 38.2%: These represent weaker support/resistance zones where minor reversals may occur.
50% and 61.8%: These are psychologically important levels where stronger reactions typically happen. Breaking above 61.8% often signals trend continuation, while falling below 38.2% may indicate further decline.
78.6%: A break beyond this level suggests potential extreme price movement.
Historical example: Bitcoin frequently found resistance at 61.8% during its 2023 consolidation phase.
2. Gauging Trend Strength
Bullish trends: Prices easily surpassing 61.8% indicate strong momentum, while stalling at 38.2% suggests weakness.
Bearish trends: Rapid drops below 38.2% confirm strong selling pressure, while holding above 61.8% may precede rebounds.
3. Combining with Other Indicators
For higher accuracy, combine Fibonacci with:
Moving averages: Convergence with long-term MAs (e.g., 200-day MA) strengthens significance.
RSI: Overbought/oversold readings at Fibonacci levels enhance reversal signals.
Volume: Increased trading volume at breakouts confirms validity.
Key Considerations
1. Market Uncertainty
While Fibonacci levels provide guidance, Bitcoin remains susceptible to black swan events like regulatory changes or exchange hacks. For instance, the 2024 Hong Kong Bitcoin ETF approval caused temporary volatility.
2. Timeframe Differences
Long-term charts (weekly/monthly): More reliable for major trend analysis.
Short-term charts (hourly/4-hour): Prone to false breakouts; always verify across multiple timeframes.
3. Market Sentiment
Macro factors (Fed policy) and industry developments (halving events) significantly impact Bitcoin. The 2024 halving anticipation, for example, boosted long-term holder confidence.
Conclusion
Mastering Fibonacci retracement involves:
Prioritizing key levels: Focus on price action around 50% and 61.8%.
Multi-indicator confirmation: Use RSI, volume, and trend lines for confluence.
Risk management: Always set stop-losses near Fibonacci levels.
By backtesting historical patterns (like the 2017 bull run and 2022 bear market), traders can refine their Fibonacci strategy. Remember—markets evolve continuously, so ongoing learning is essential for crypto success!
Got questions about specific setups or historical examples? Drop them in the comments! 🚀


No comments yet