


Bitcoin fluctuates near $80k amid rising bearish sentiment. Will this recovery nullify the double-bottom reversal possibilities?
Following Monday’s massive sell-off, global markets are witnessing a quick turnaround, mirroring Bitcoin’s price rebound. After hitting a low of $74,434, the BTC price has experienced a swift bounce-back.
With the lower price rejection, Bitcoin reached a 24-hour high of $80,836. However, the struggle continues to sustain the crucial $80,000 mark due to significant overhead supply.
Currently, Bitcoin trades at a market value of $79,597, struggling for a double-bottom reversal. Will this bullish struggle lead to a bounce-back above the $82,000 mark?
Bitcoin Price Holds Above $75k, Bulls Target $82k Breakout
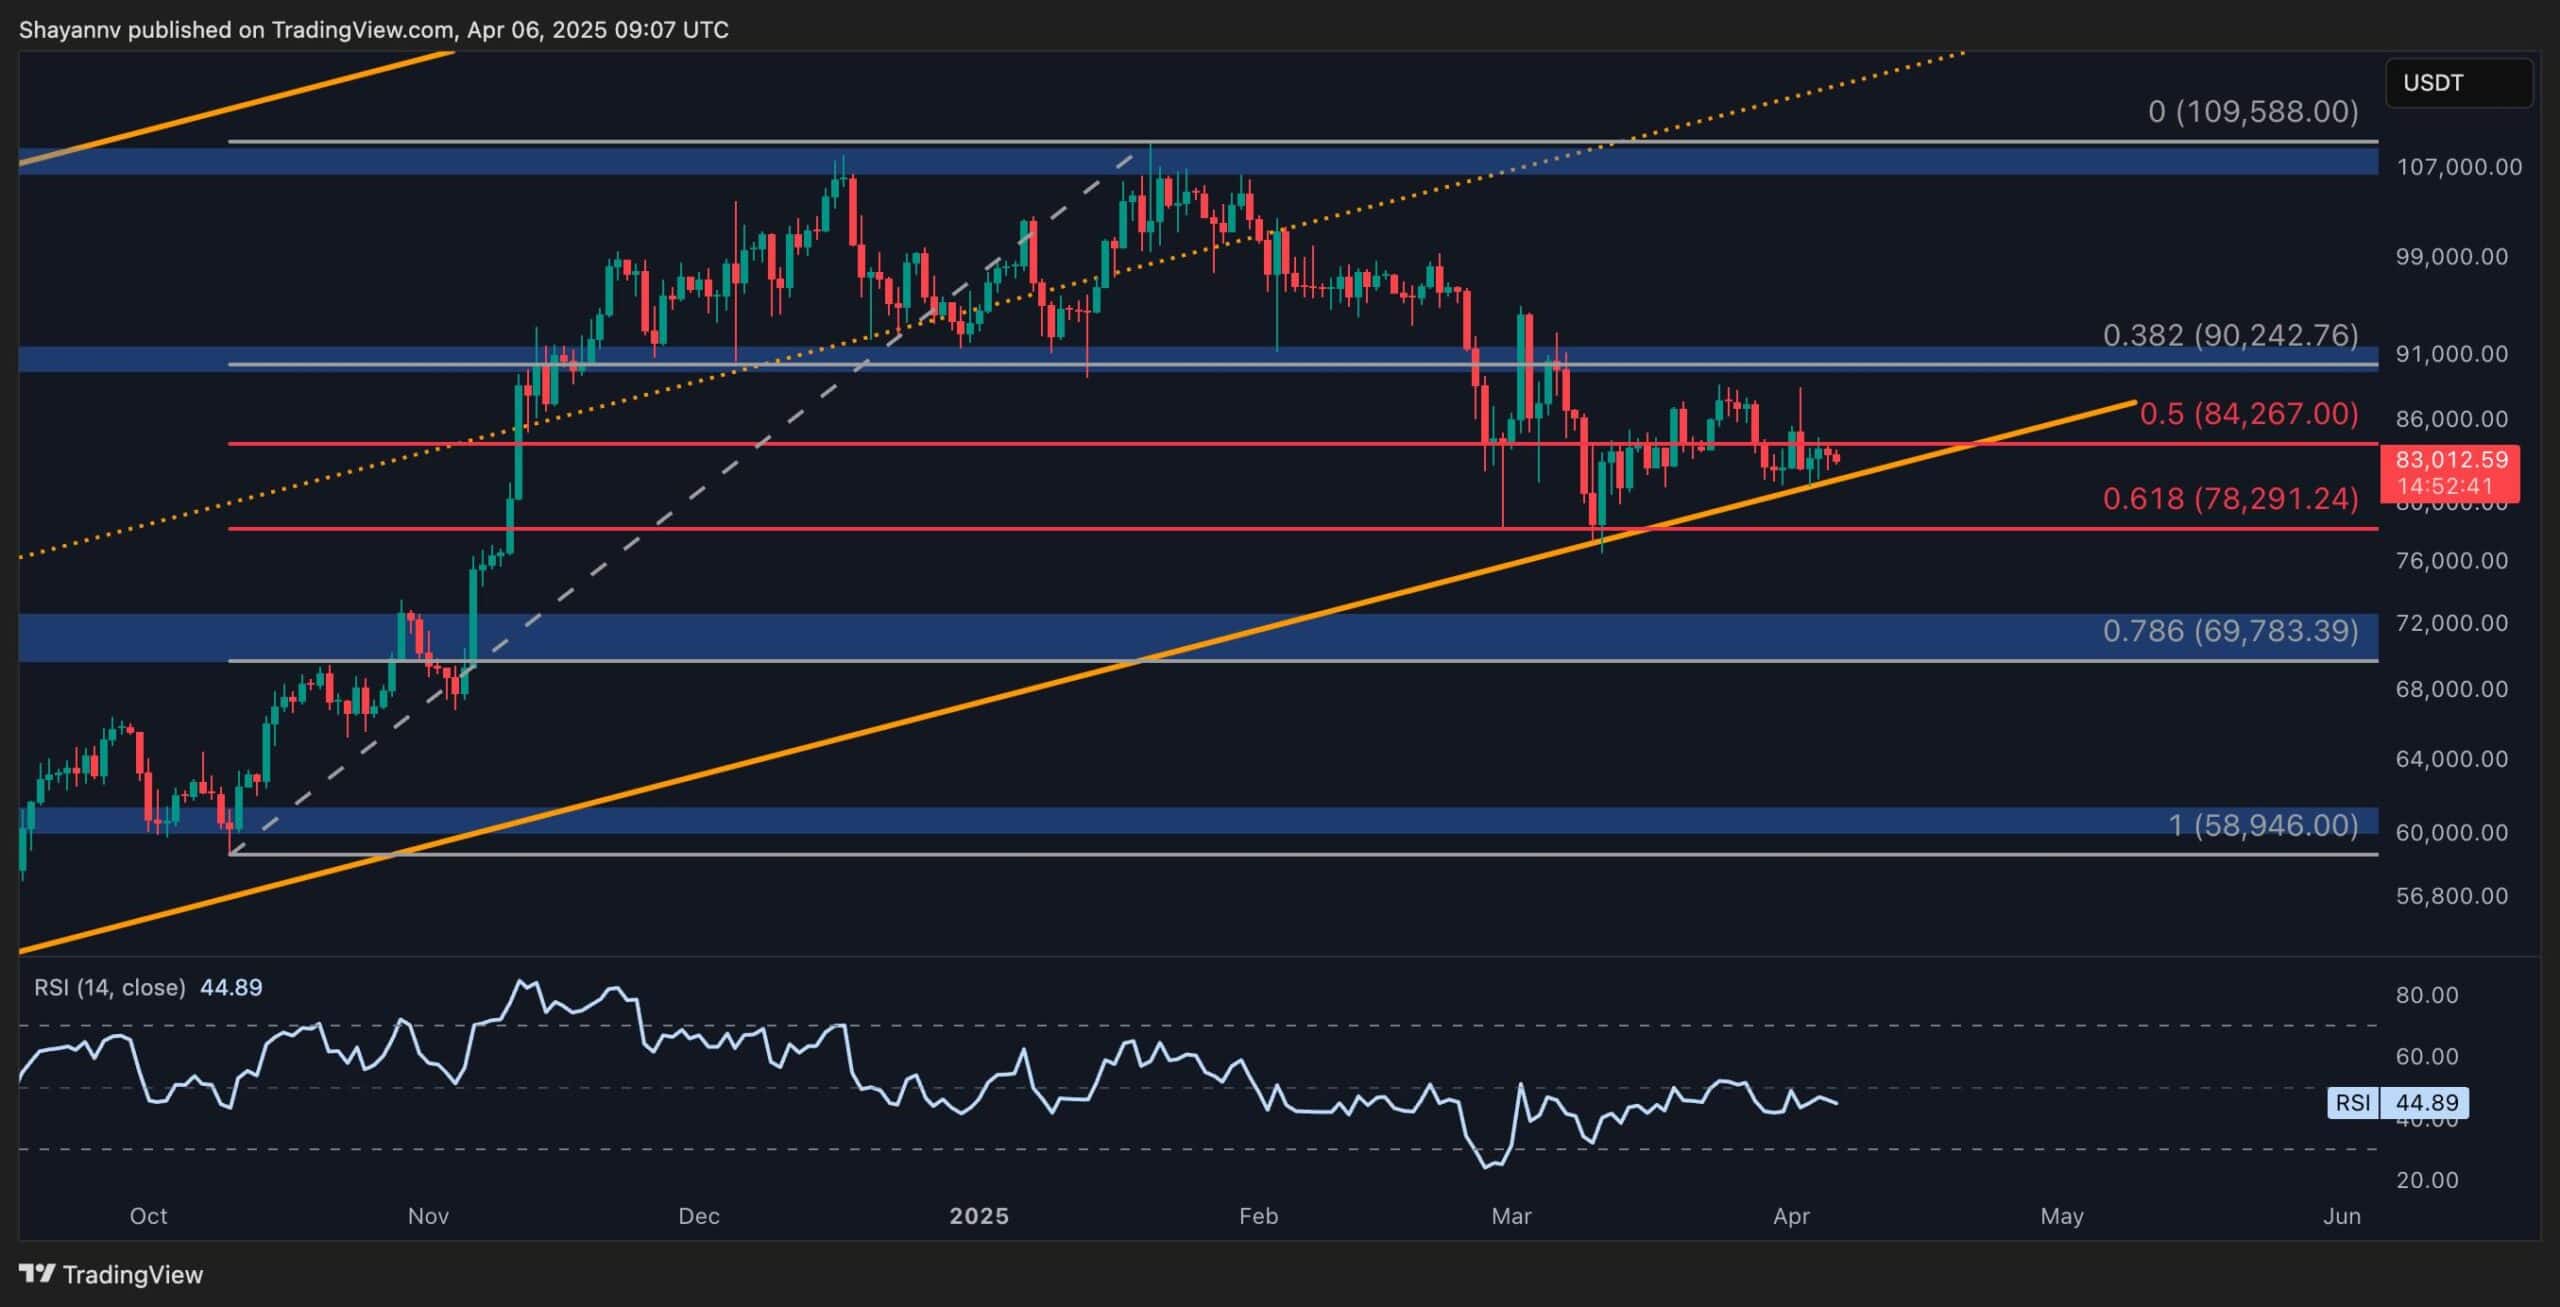
On the daily chart, Bitcoin’s price trend shows bullish support above a crucial support level. The price zone extends from $75,637 to $76,462, coinciding with the 50% Fibonacci level near $75,500.
The bounce-back suggests a potential extended recovery as buyers maintain dominance at this crucial support. However, due to intense overhead supply, the uptrend fails to reach the 61.80% level at $81,855.
The long wick formation in the intraday candle reflects buyers struggling to maintain momentum. Additionally, due to the prevailing downturn, the 50-day and 200-day simple moving average lines have given a negative crossover, signaling a “death cross” and triggering a sell signal for price action traders.
However, the underlying support for BTC at the 50% Fibonacci level leads to a lower price rejection, hinting at a double-bottom pattern. The daily RSI line supports the possibility of a double-bottom reversal with a minor bullish divergence. Thus, technical indicators and price action analysis suggest a double-edged situation for Bitcoin.
Bitcoin ETFs Daily Outflow Crosses $100M
As fear grips the market, Bitcoin ETFs recorded an outflow of more than $100 million on April 7. The daily total net inflow stood at $109.21 million, with 6 Bitcoin ETFs recording net outflows.
The remaining six ETFs maintained net zero outflows. Grayscale recorded the largest outflow, $74.01 million, followed by Invesco, $12.86 million. The other four ETFs experienced outflows of less than $7 million.
Will Bears Crash Bitcoin Amid Rising Short Positions?
The surge in volatility is also shaking up the Bitcoin derivatives market, with massive fluctuations in underlying sentiment. Massive liquidations have dropped Bitcoin’s open interest to $51.35 billion, marking a 0.99% drop in the past 24 hours.
However, the funding rate remains positive at 0.0021%. Despite this, short positions have significantly increased over the past 12 hours.
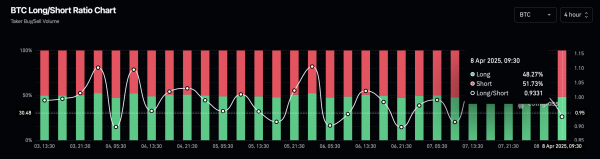
According to the Bitcoin long-to-short ratio chart, short positions have risen from 49.21% to 51.73%. This drop in the long-to-short ratio to 0.9331 signals a bearish sentiment.
As a silver lining, over the past 24 hours, long volume has increased by 34% to reach $98.11 billion, while short volume remains at $97.43 billion, suggesting a significant recovery.
Should You Buy the Dip in Bitcoin?
The increased volatility in Bitcoin prices due to Donald Trump’s tariffs has increased uncertainty in the financial and crypto markets. Currently, the BTC price action analysis suggests a potential double-bottom reversal.
However, technical signals and the derivatives market point to the possibility of an extended correction. Hence, as Bitcoin fluctuates between the 50% and 61.80% Fibonacci levels, it marks a no-trading zone.
A decisive close beyond this range will trigger an entry opportunity for traders. In the case of a bullish breakout, the 78.60% level signals upside potential toward nearly $92,000. However, an extended correction will likely test the $70,000 mark.


No comments yet