


Market watcher Philip from TradingView highlights Bitcoin long-term strength, calling attention to a key support level and potential growth to new all-time highs.
Bitcoin’s price has been fluctuating in recent days, with the cryptocurrency seeing a sharp decline followed by immediate signs of stabilization. On April 2, Bitcoin traded around $87,000, but by April 7, it had dropped to about $74,000.
The crypto asset has since recovered to over $77,000, currently sitting at $79,131.11. This marks a 3.85% increase over the past 24 hours, although it still reflects a –5.27% decline over the past week.
Bullish Signals Amid Market Weakness
Despite the broader market experiencing significant sell-offs, Bitcoin’s resilience has not gone unnoticed. Analyst Philip, from TradingView, points to Bitcoin’s strength as a positive sign.
He noted that, while the stock market continues to decline, Bitcoin and many other cryptocurrencies are holding strong. This behavior suggests bullish strength, as Bitcoin has held its ground, even amid the market’s downward movement.
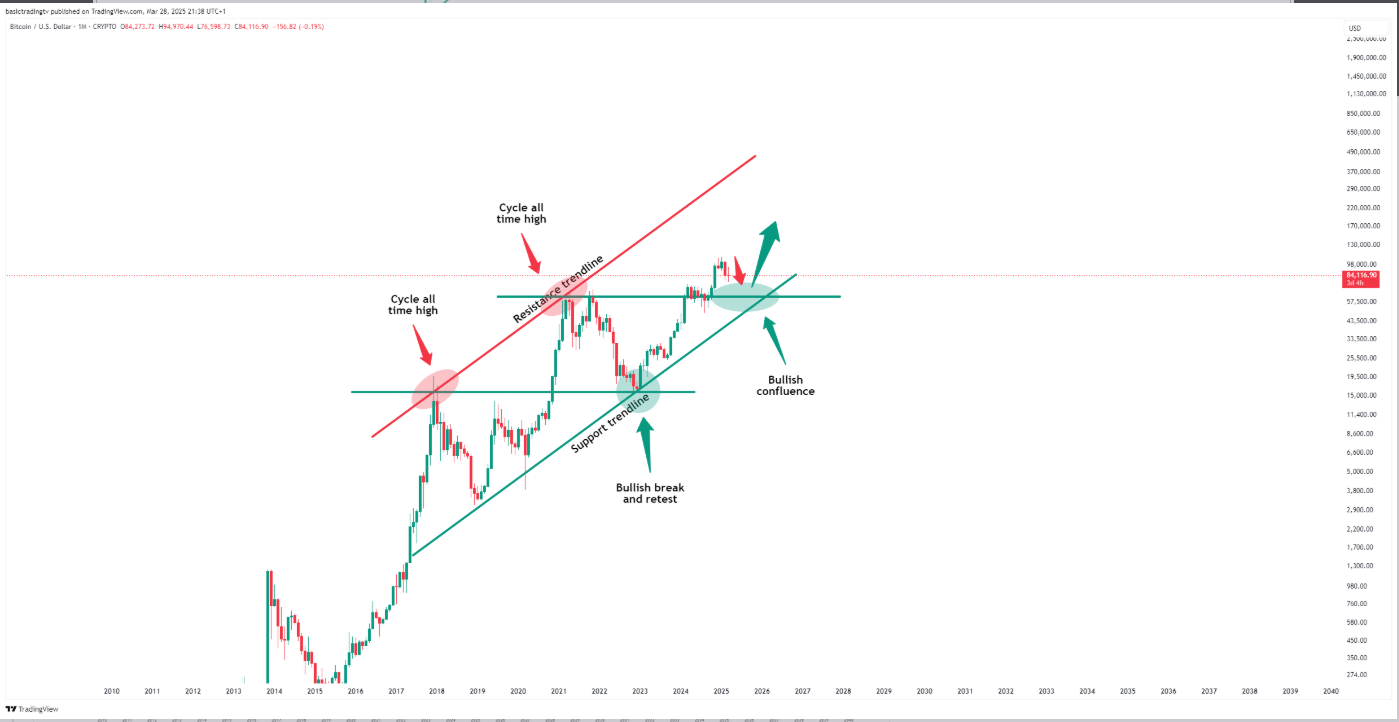
Philip’s chart analysis shows that, historically, Bitcoin has experienced periods of consolidation followed by significant price increases. He draws attention to past all-time highs, including the $15,000 peak in late 2017 and the more recent $59,000 high in 2021.
Philip highlighted Bitcoin’s ability to break above key resistance levels, then retest those levels as support, a classic sign of a strong market.
Moreover, Philip emphasized that the overall macro trend is still pointing toward higher prices. The $70,000 mark is particularly noteworthy, as it has been identified as a key level to monitor.
Ultimately, Bitcoin has previously broken above resistance levels, and such retests have often preceded bullish surges. Consequently, Philip’s chart indicates optimism, indicating that Bitcoin could eventually reach levels between $170,000 and $220,000.
Bearish Sentiment from Another Analyst
On the other hand, analyst Daniel has a more cautious outlook on Bitcoin’s short-term performance. Daniel highlights that Bitcoin is currently trading within a descending channel, a pattern that suggests a bearish market structure.
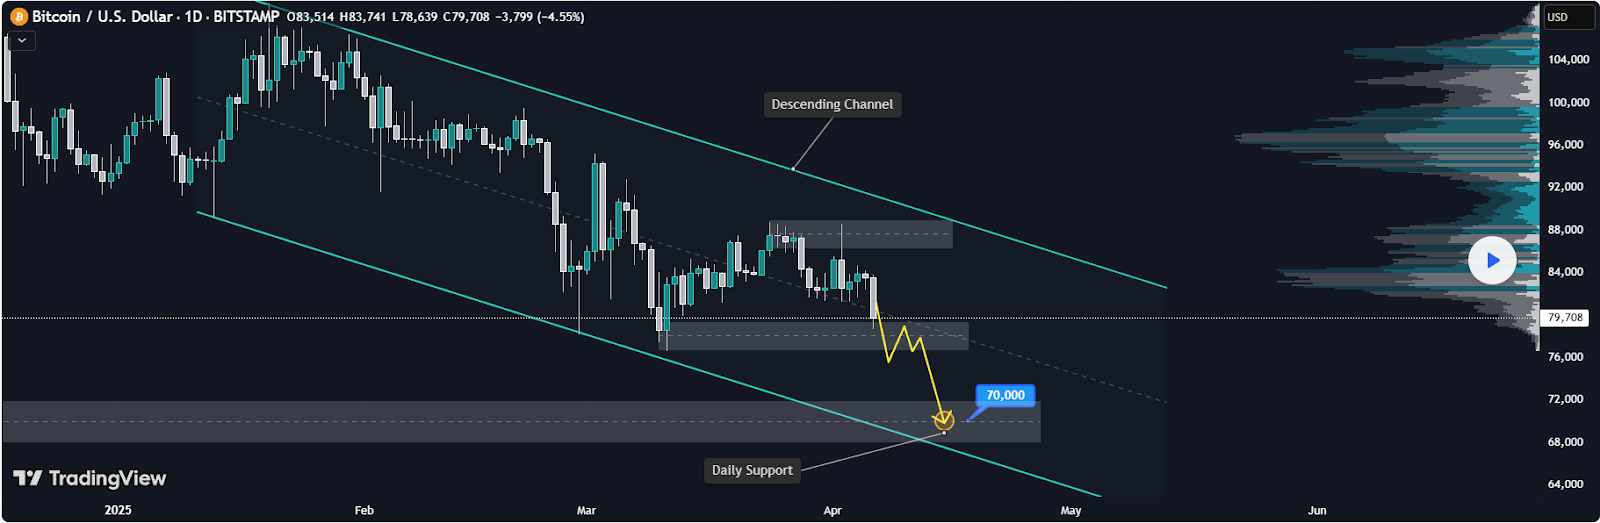
After Bitcoin’s rejection from the upper boundary of this channel, the price retraced to a support zone around $78,000.
Daniel suggests that this support level may not hold if selling pressure persists. A breakdown below this zone would likely push Bitcoin price toward the $70,000 range, which is in line with the lower boundary of the descending channel.
He also warns that, unless there is a major shift in market momentum, the overall direction remains bearish. As such, traders should watch for confirmation of further price declines, such as lower highs and weak bullish pullbacks. Daniel also points to the importance of volume on red candles, which could provide further confirmation of bearish sentiment.


No comments yet