


Ripple has notably declined due to escalating tariff wars, breaking below the crucial 200-day moving average at $1.8. However, the price still faces a key support zone, and if this level is breached, the asset could experience a substantial downturn.
XRP Analysis
By Shayan
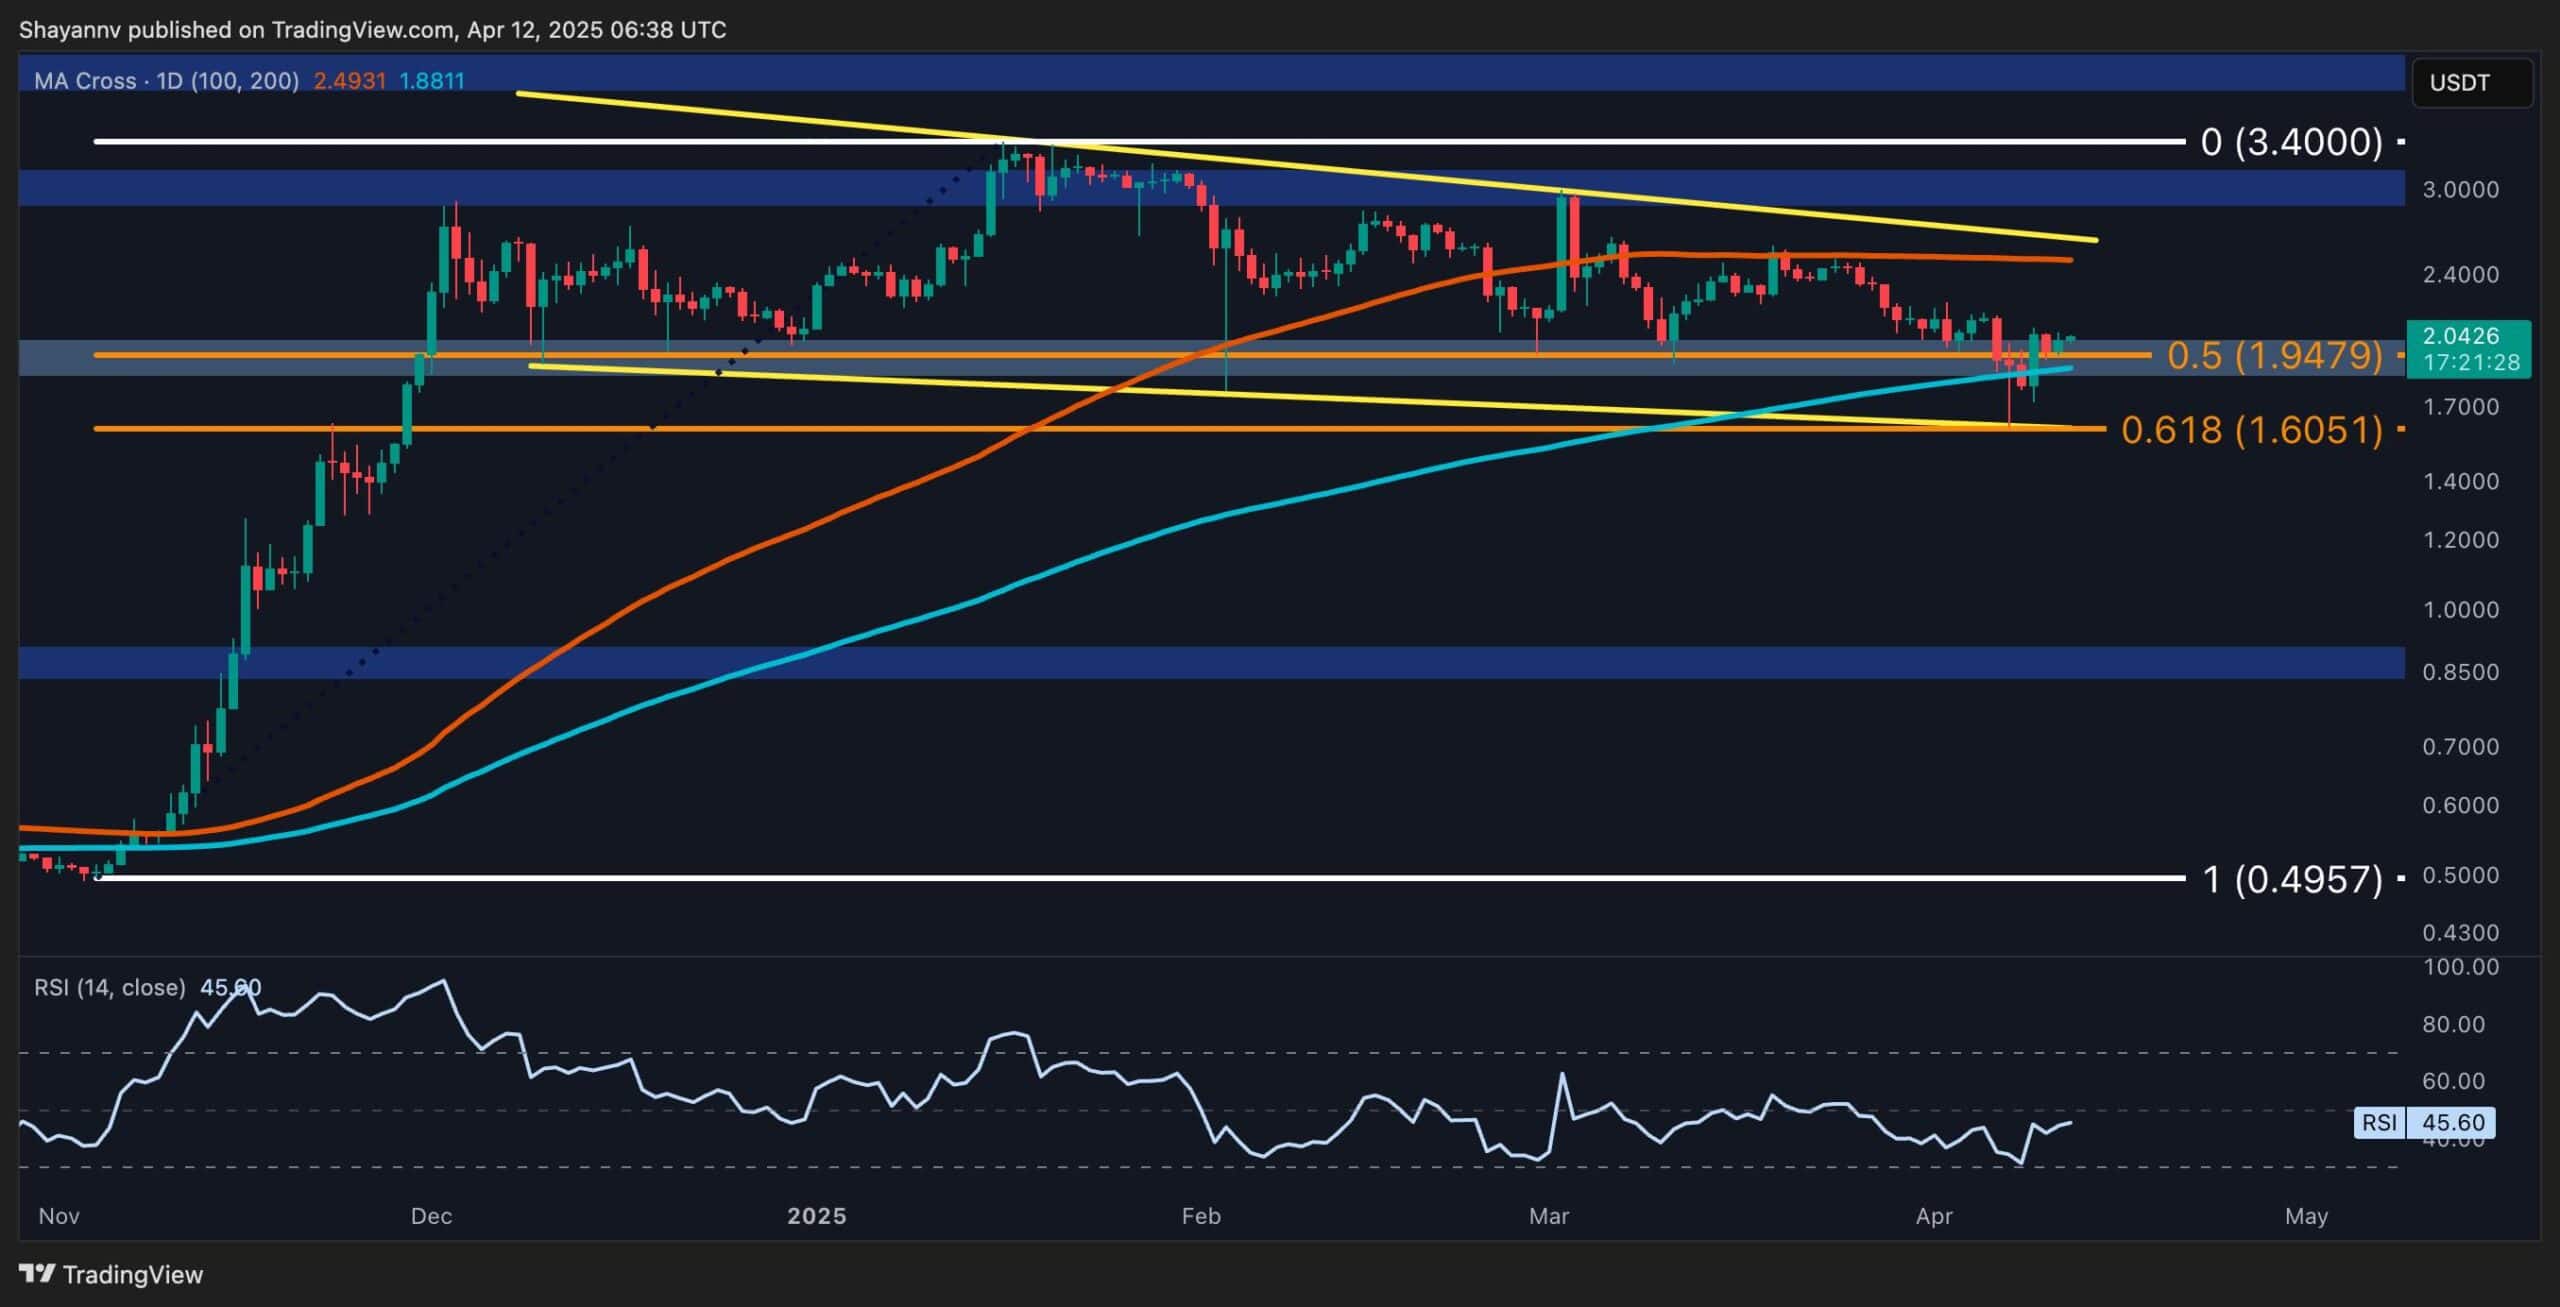
The Daily Chart
XRP recently dumped hard by double digits, driven by a risk-off market sentiment and distribution behavior linked to global tariff tensions. This downward pressure pushed the price below the critical 200-day moving average at $1.8, reinforcing bearish sentiment as market participants shift toward safer assets like gold.
However, Ripple is now approaching a significant support region near the 0.618 Fibonacci level at $1.6, which aligns with the wedge’s lower boundary.
This area is expected to act as a strong support, potentially leading to consolidation. However, if selling pressure intensifies and the price breaks below this level, a deeper downtrend toward lower levels will become increasingly likely.
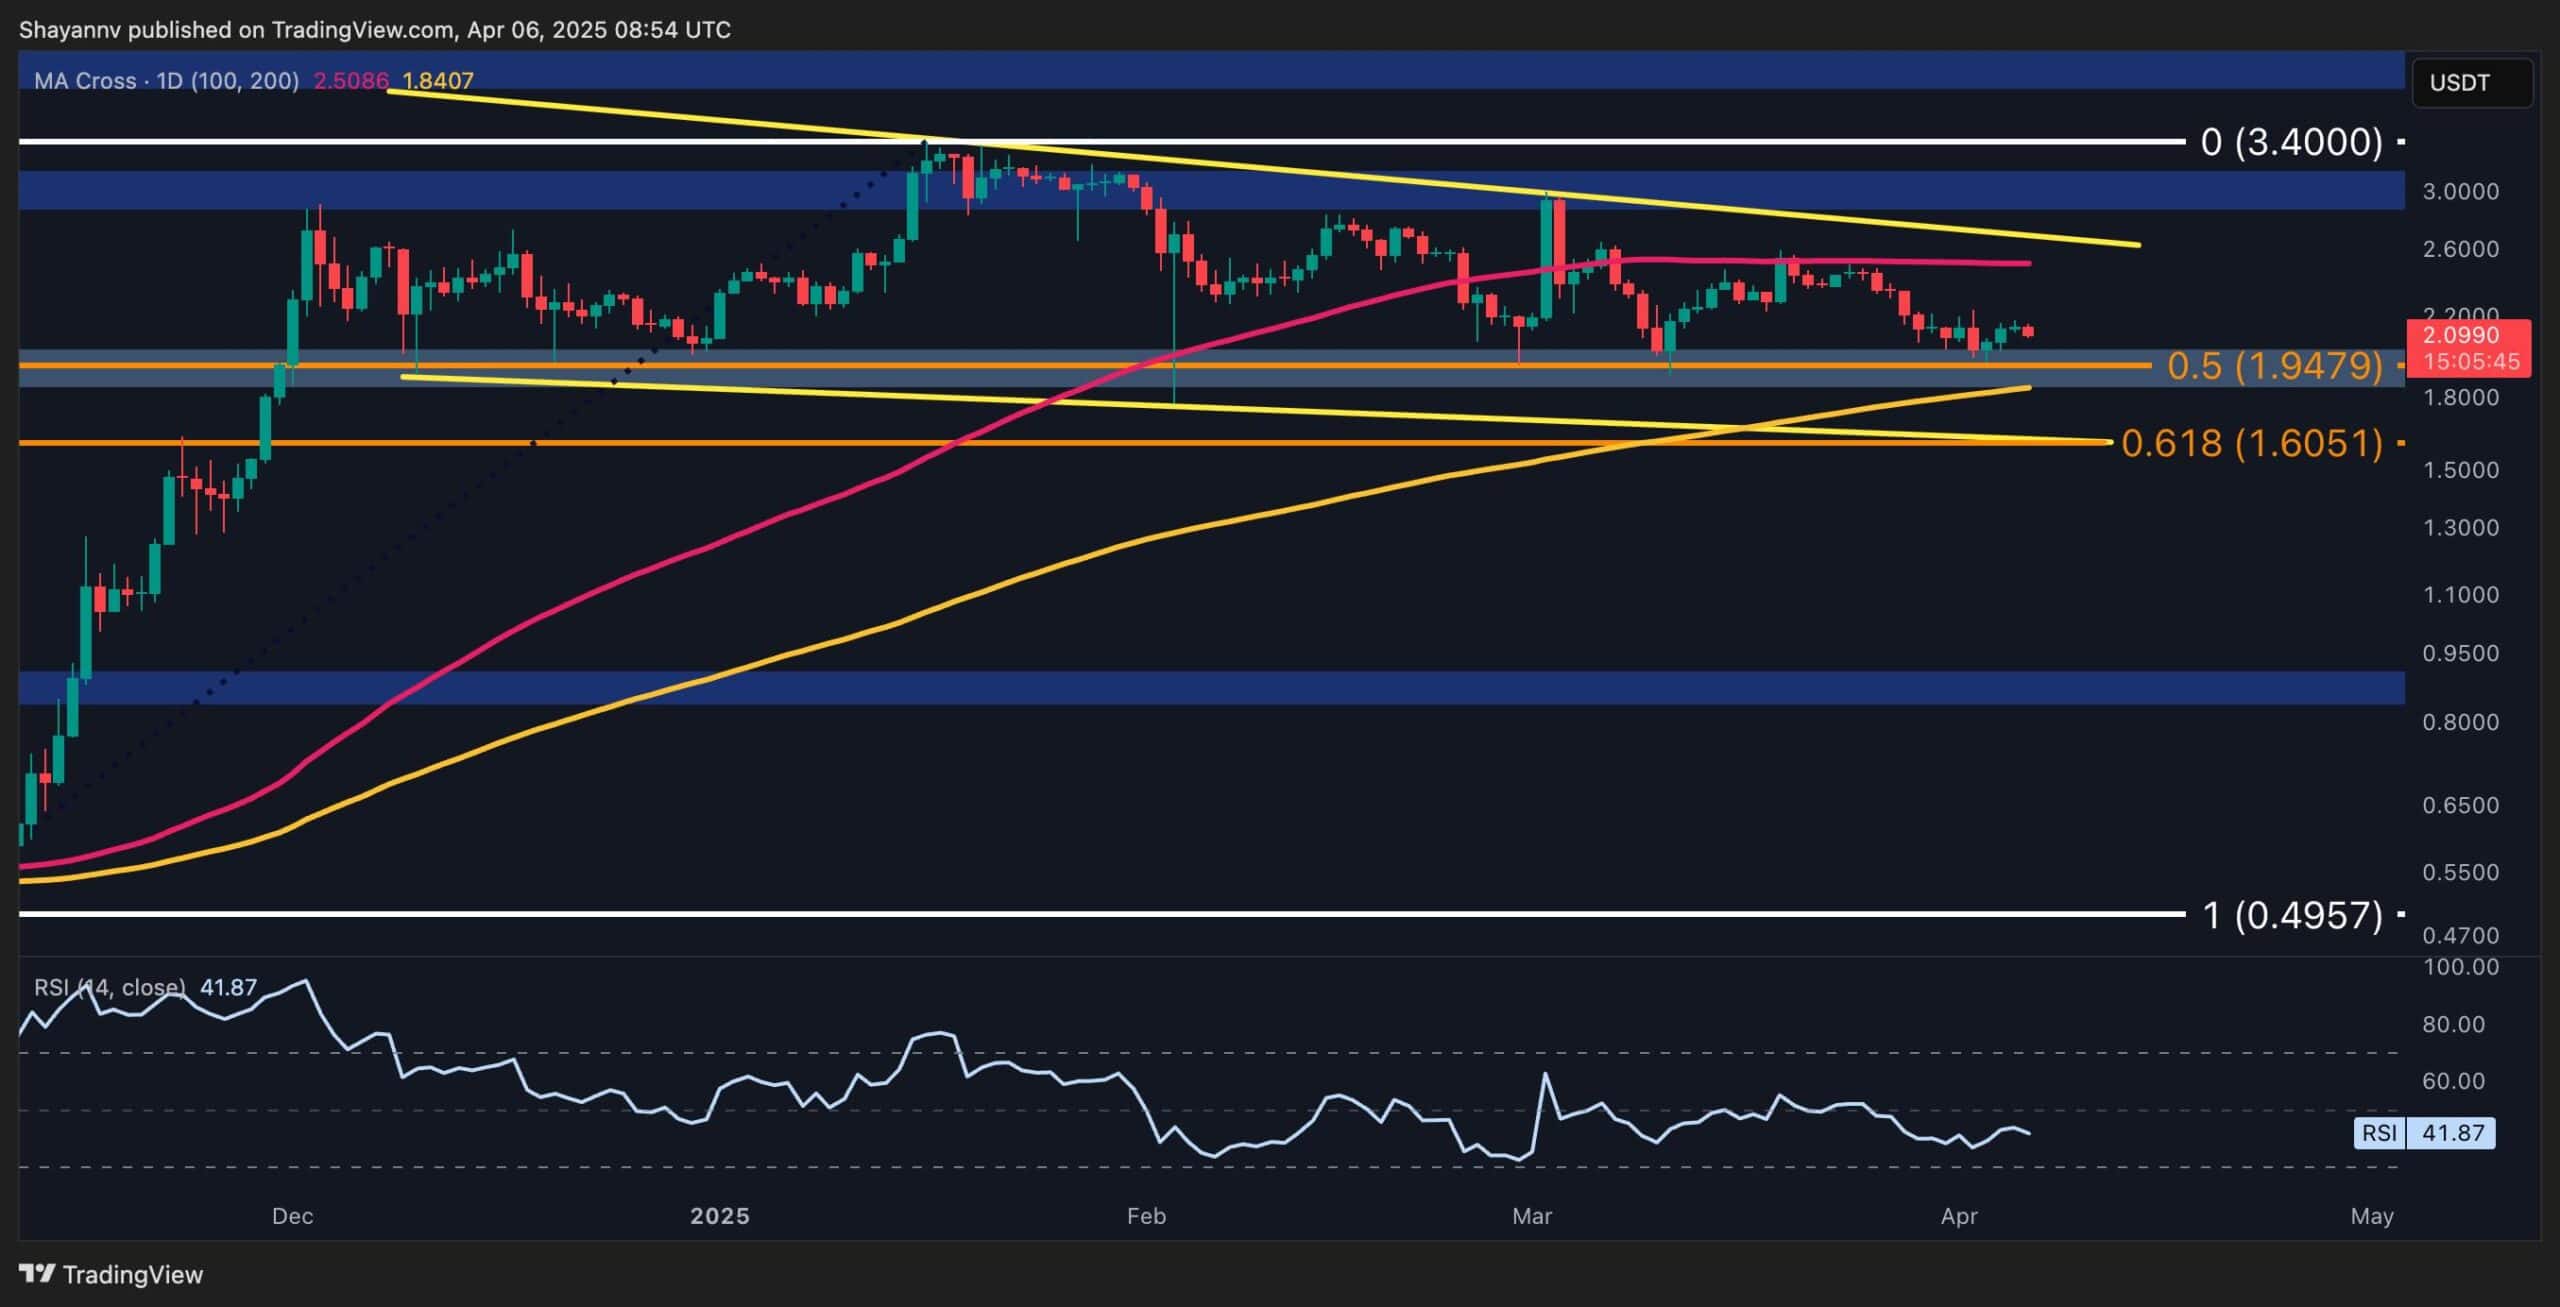
The 4-Hour Chart
On the 4-hour timeframe, XRP’s recent surge in selling pressure led to a breakdown below the lower boundaries of both the expanding wedge and the descending flag pattern at $1.8, strong bearish signals. Despite this, the asset has since rebounded, retracing toward the broken level and testing the last supply zone at $2.
If Ripple faces rejection at this resistance, the bearish breakout will be confirmed, increasing the likelihood of another downward leg toward the $1.5 threshold. The upcoming price action near this supply zone will be crucial in determining Ripple’s next move, with a bearish continuation being the most probable scenario.


No comments yet