


Bitcoin’s recent decline has brought it to a critical technical juncture, where it’s testing important support levels after a break from a multi-week rising channel.
While short-term momentum looks weak, long-term on-chain metrics may hold the key to understanding whether this correction has more downside or if buyers will soon step back in.
Technical Analysis
The Daily Chart
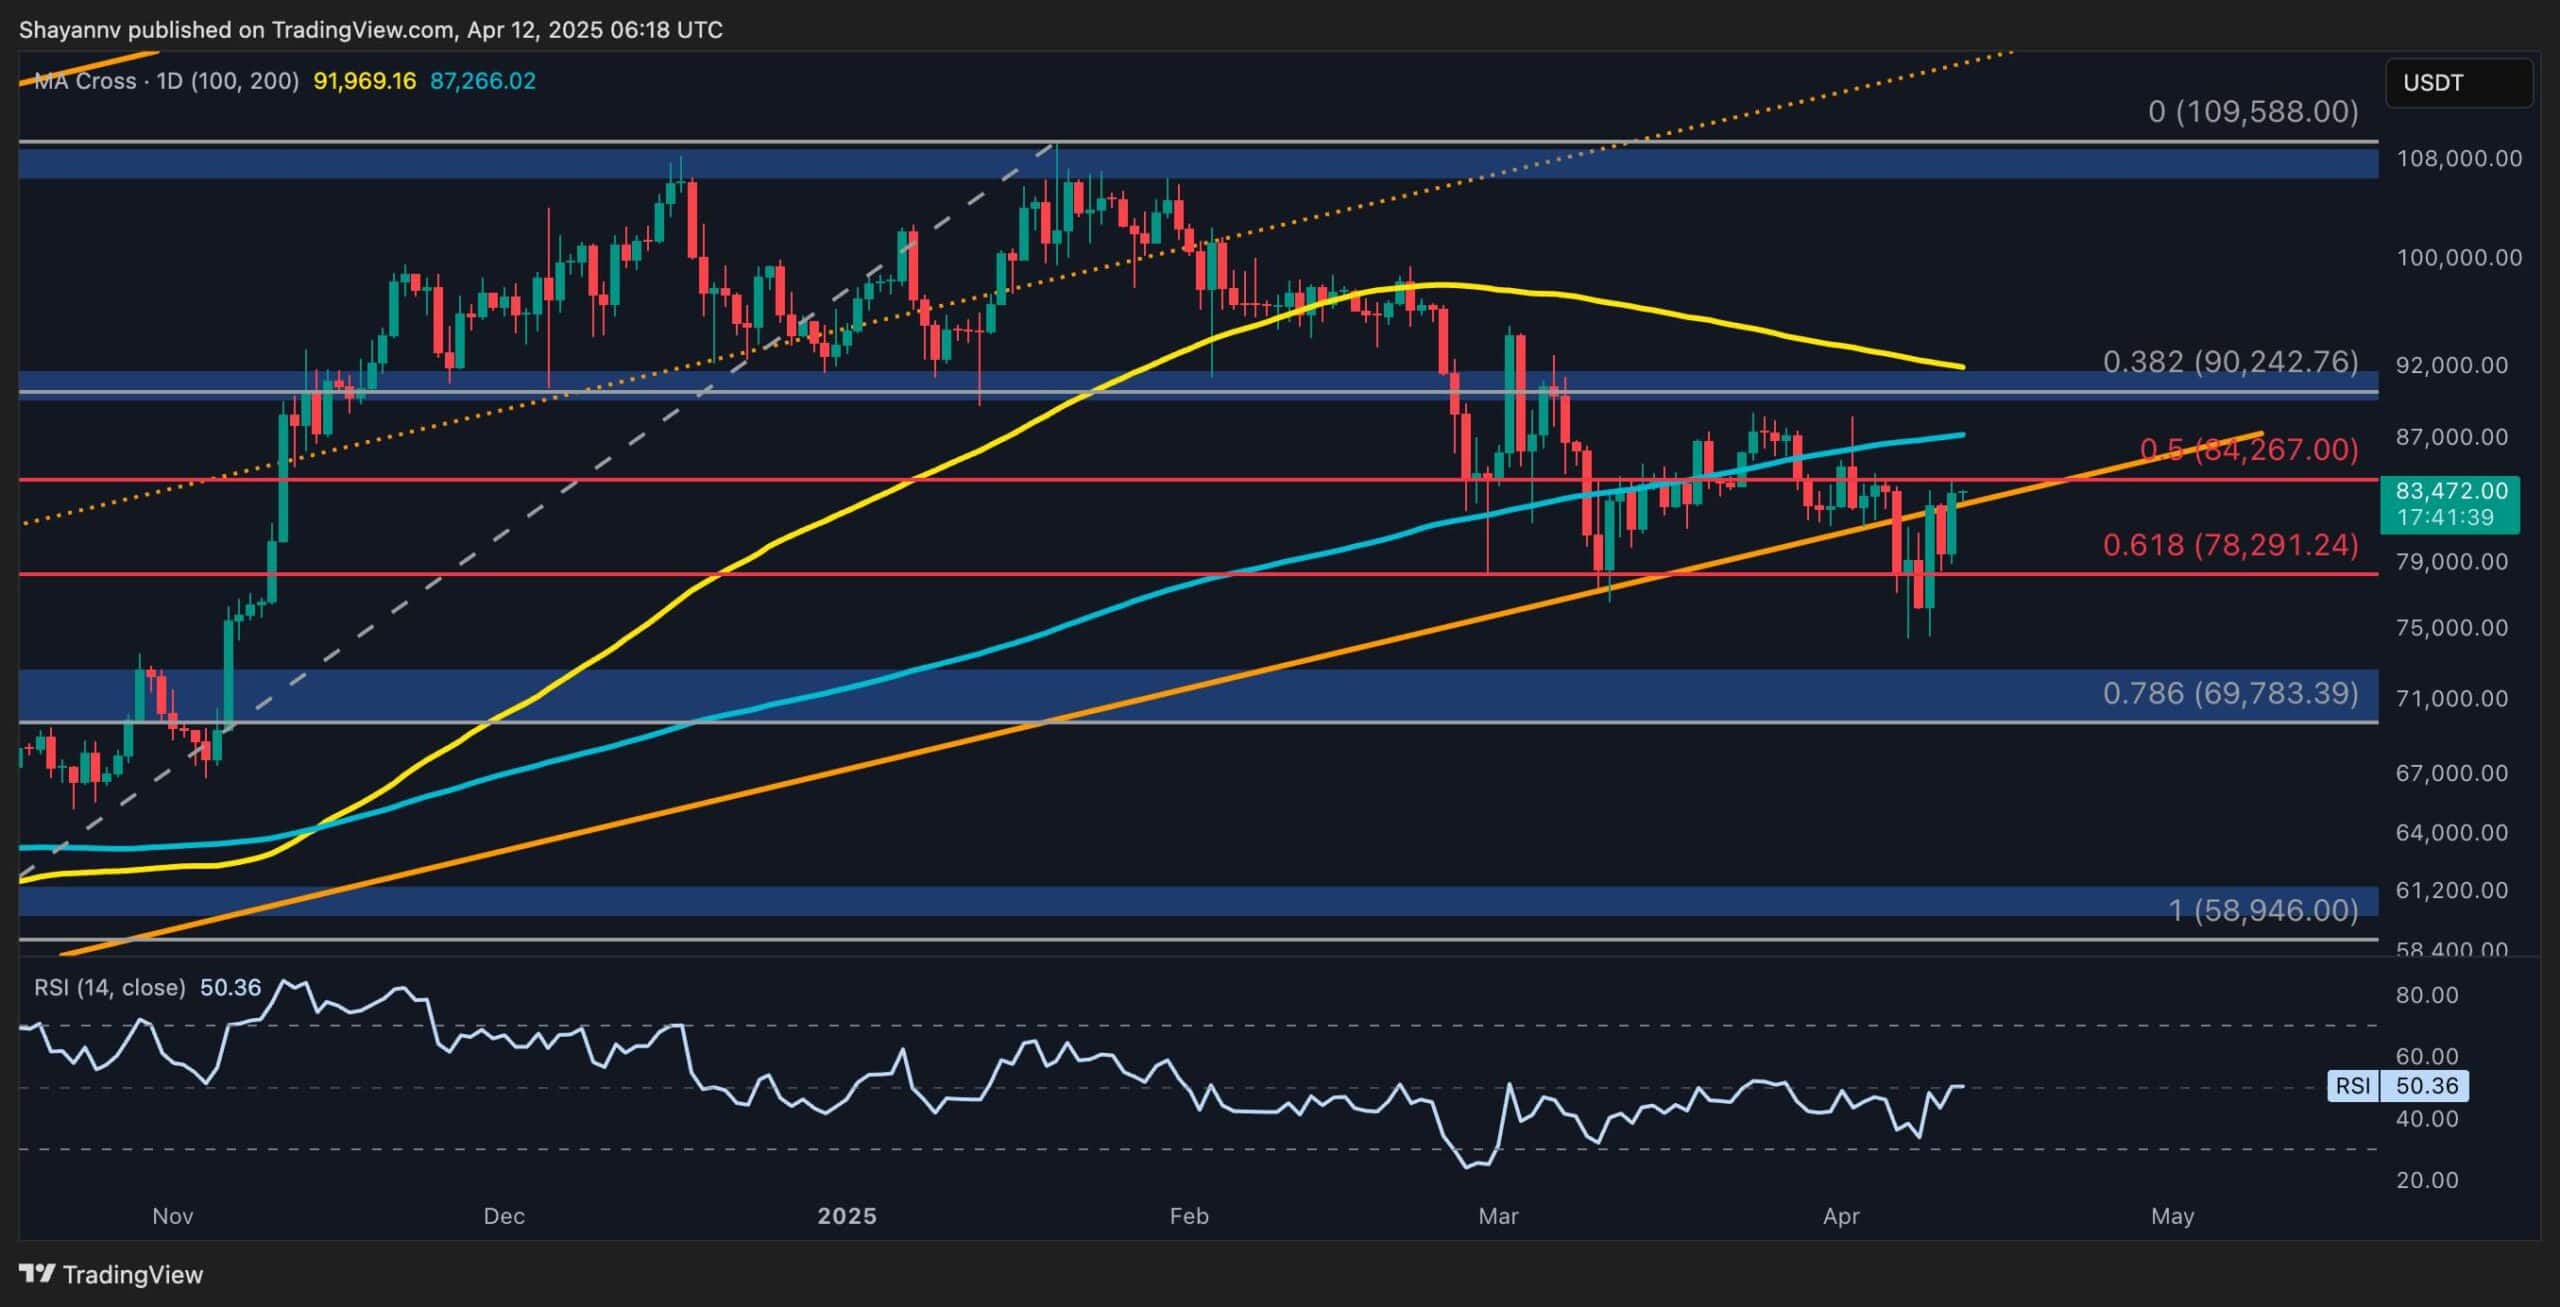
On the daily chart, BTC has officially broken below the 200-day moving average, located around the $88K mark, a significant technical element that often defines the trend. This breach comes after weeks of sideways to downward price action, with multiple rejections from the $88K–$92K resistance zone.
The asset is currently hovering around the $77K–$78K range, just above a strong demand zone near $74K. The RSI has also dipped near the oversold region, suggesting bearish momentum but also hinting at potential exhaustion. If $74K fails to hold, the next significant support is around $68K, whereas a recovery above $80K could open the door for another test of $84K and eventually the 200 DMA.
The 4-Hour Chart
The 4H timeframe paints a clearer picture of the recent breakdown. After weeks of consolidation within a rising channel, BTC decisively broke to the downside, triggering a wave of liquidations and fear.
The price briefly dropped as low as $74K before bouncing and retesting the $80K resistance level. That rejection has resulted in a lower high, reinforcing short-term bearish control. Moreover, the RSI is beginning to recover from deeply oversold territory, but the structure still favors sellers unless BTC can flip $80K back into support and reclaim the $82K–$84K zone.
On-Chain Analysis
Adjusted SOPR (aSOPR – EMA 30)
The Adjusted SOPR remains slightly above the neutral threshold at around 1.1, indicating that, on average, holders are still selling their BTC at a profit. However, the downtrend in aSOPR is notable and suggests that profitability across the network is shrinking. If this trend continues and aSOPR approaches or dips below 1, it could reflect growing capitulation and short-term bearish sentiment.
For now, though, the market hasn’t entered full loss realization territory, which leaves room for further downside pressure before a potential bottoming scenario. Investors should now watch for how quickly aSOPR stabilizes. Holding above one could support a swift rebound, while a drop below it may signal broader risk-off behaviour.


No comments yet