


The V-shaped recovery in Dogecoin faces exhaustion near $0.168, risking a triangle pattern breakdown. Will DOGE dip to the $0.13 zone?
At $0.15936, Dogecoin struggles to hold a triangle pattern as selling pressure grows. The biggest meme coin has a market cap of $23 billion and has dropped 3.54% in the last 24 hours.
As market volatility persists, meme coins are poised for high-momentum moves in either direction. Could Dogecoin see a swift correction toward $0.13?
Dogecoin Price Analysis
On the 4-hour technical chart, Dogecoin forms a V-shaped recovery from the $0.13219 level, initiating a short-term rally that peaked at the $0.1680 resistance.
Alongside this recovery, DOGE’s price action forms a triangle pattern. Recently, Dogecoin completed a downswing, testing the local support trendline within this pattern.
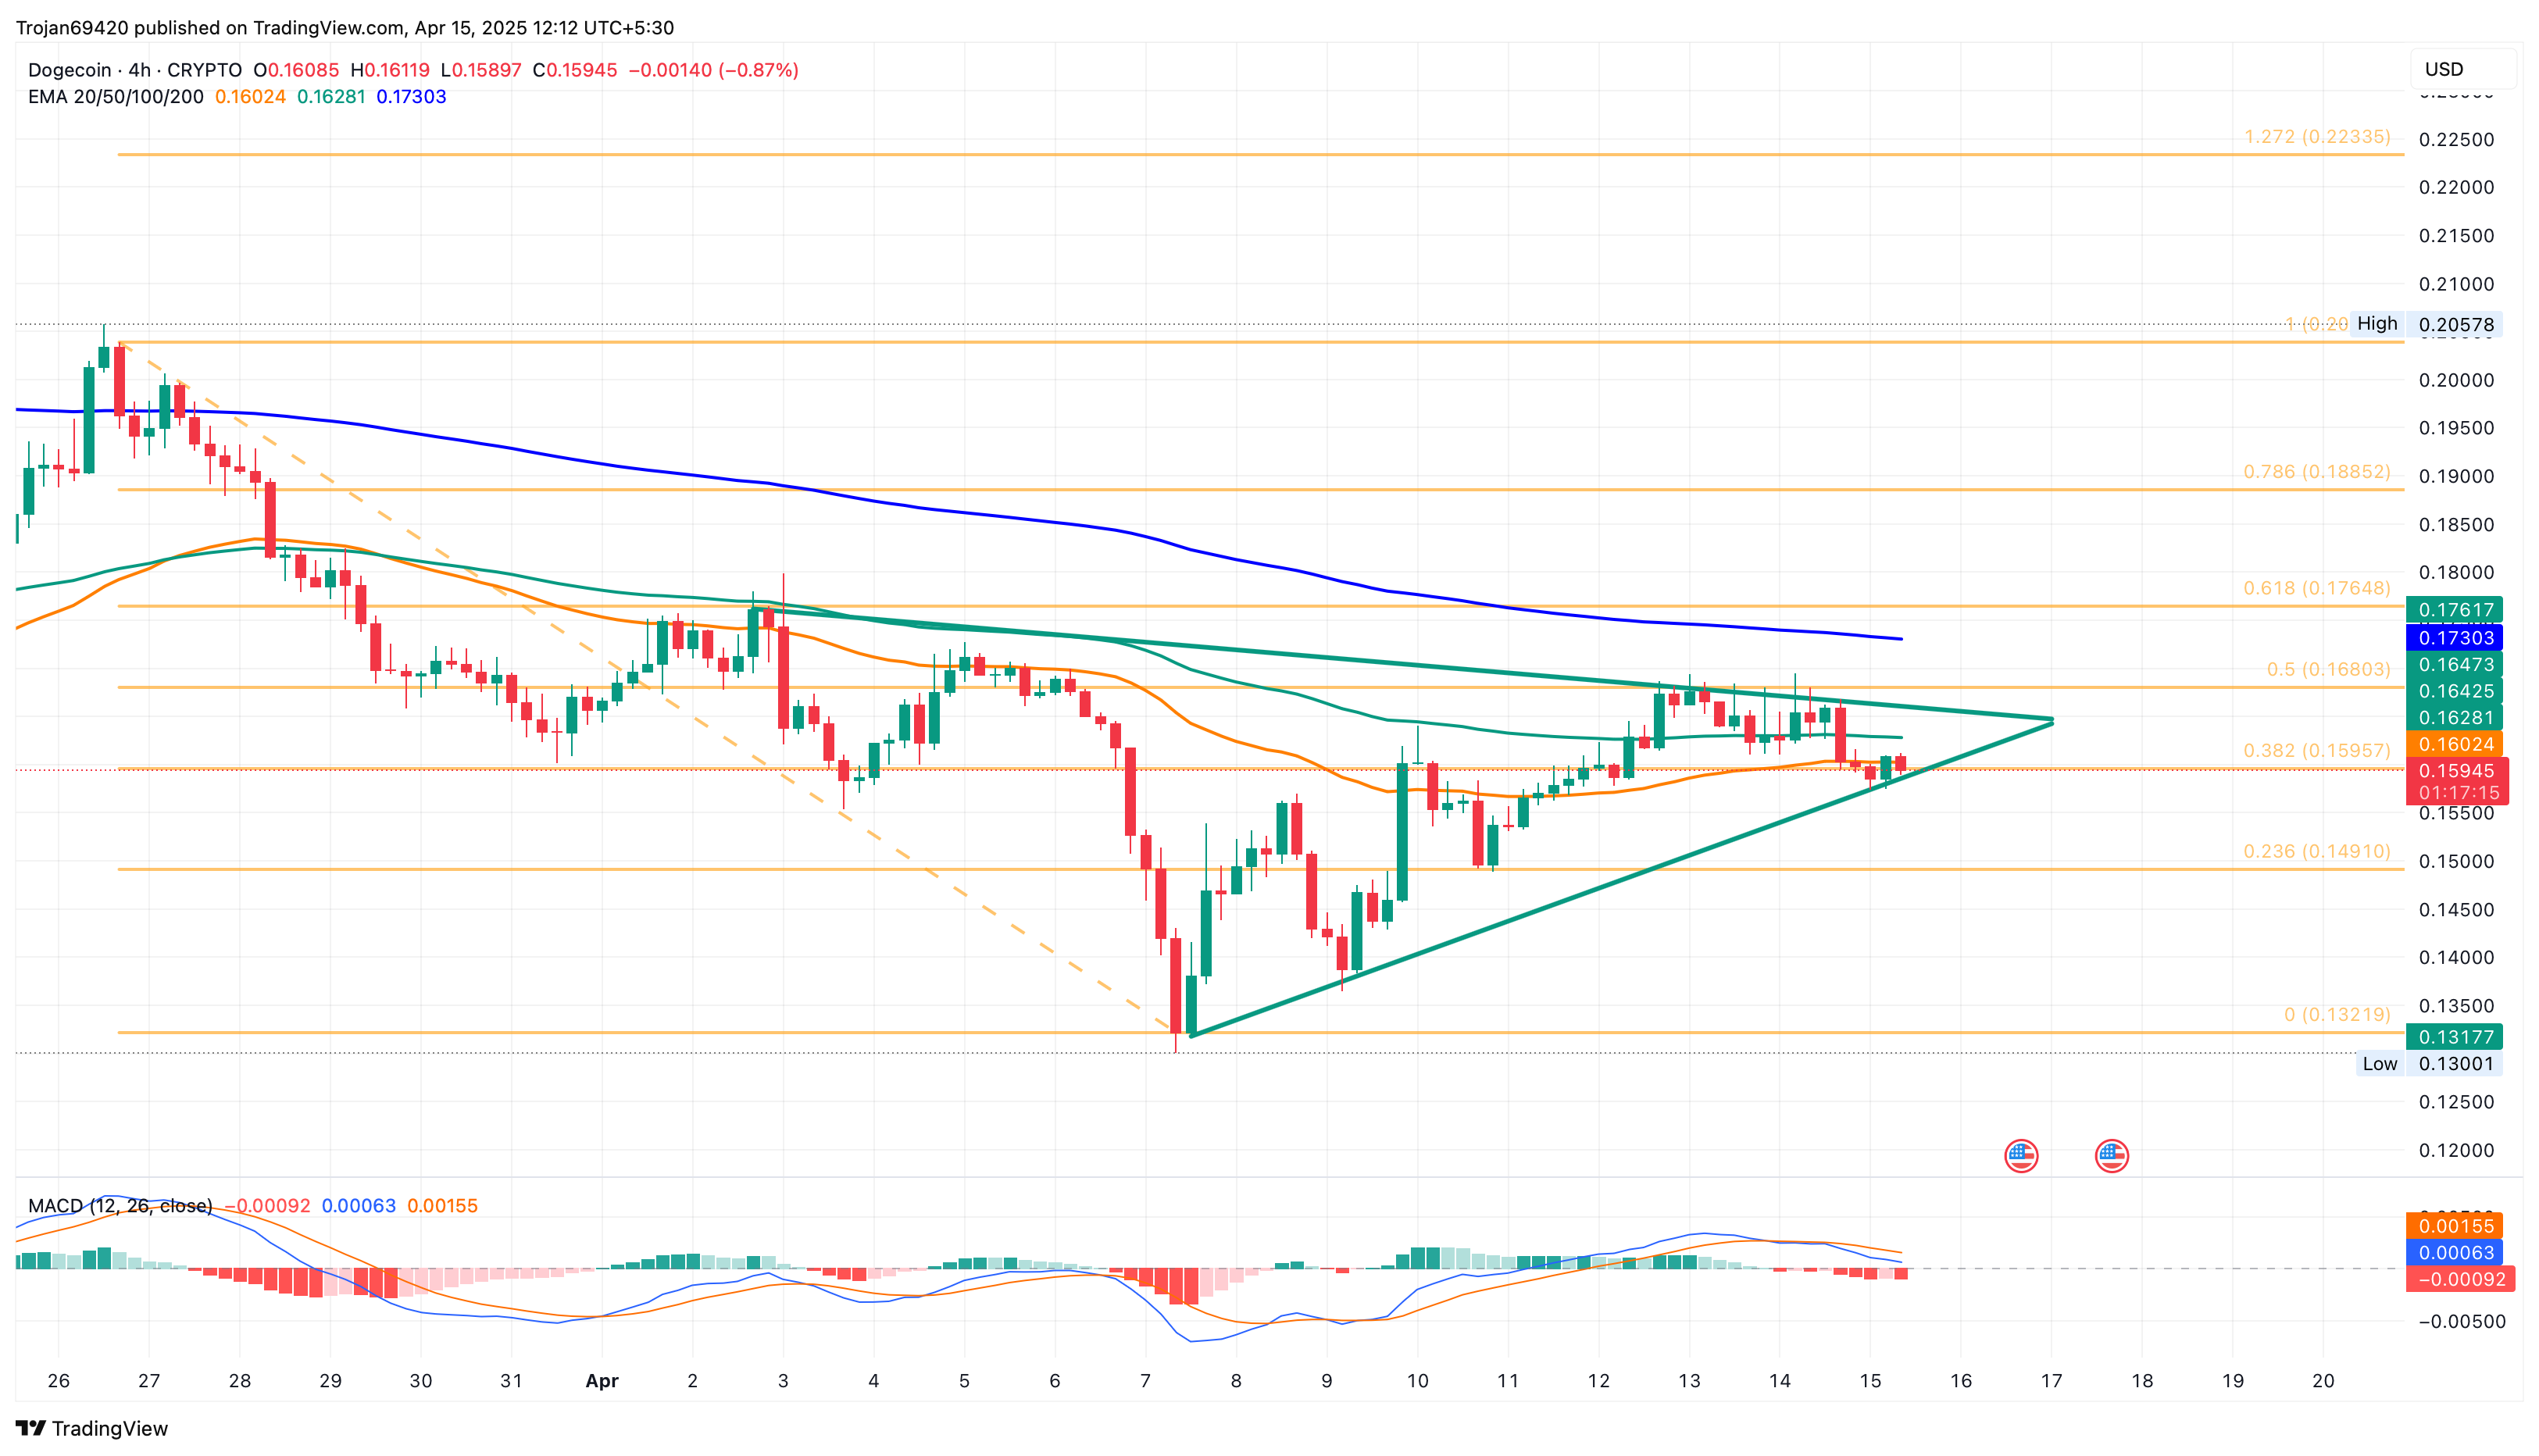
Facing short-term pressure, DOGE has slipped below the 50 and 100 EMA lines on the 4-hour chart. Moreover, the sudden decline in bullish momentum has triggered a bearish crossover in the MACD and signal lines.
As a result, technical indicators suggest a potential breakdown and price drop due to a triangle pattern meltdown.
Rising Bearish Sentiments Signal Downside Risk
As Dogecoin price nears a potential triangle pattern breakdown, bearish sentiments are growing in the derivatives market. The Long/Short ratio has dropped to 0.8025, with the short positions reaching 55.48%.
The increasing bearish sentiments meet increased trading activity, reflected by the 0.82% rise in open interest. Currently, the open interest stands at $1.57 billion, with the funding rate dropping to 0.0007% on Bybit.
Analyst Remains Optimistic on DOGE
Analyst Trader Tardigrade remains optimistic on DOGE despite the increasing downside risk. The analyst identified an inverted head-and-shoulders pattern on the 4-hour price chart, highlighting a potential rally.
The pattern’s neckline aligns with the $0.17 supply zone. A breakout above this level could propel DOGE toward the $0.20 mark.
#Dogecoin could be forming an inverse Head and Shoulders Pattern on H4 chart 🔥$Doge pic.twitter.com/OIdRQyo7Us
— Trader Tardigrade (@TATrader_Alan) April 15, 2025
Dogecoin Price Targets
Based on Fibonacci retracement levels, Dogecoin is hovering near the 38.20% level at $0.15957. A sharp correction following a breakdown could push the price down to the 23.60% level at $0.14910.
On the upside, DOGE’s key resistance is at $0.1680. If a breakout rally occurs, Dogecoin could potentially climb to $0.18852.


No comments yet