


A prominent market analyst, Peter Brandt, has issued a cautionary warning to analysts suggesting a change in Bitcoin’s trend following a trendline breakout.
The expert sounded the alarm on an X post today, urging caution amid Bitcoin’s recent resurgence. He cited a trendline on the daily timeframe, which some traders he calls “amateur charters” have identified as a possible Bitcoin trend reversal.
Meanwhile, the analysis comes amid Bitcoin’s recent rejection from the $86,000 level. The pioneering cryptocurrency retested the level again today after a failed attempt to break above the price mark over the weekend.
Trendlines: The Least Significant Chart Construction?
Brandt shared a 1-day chart showing a possible Bitcoin breakout. Notably, a descending resistance trendline has contained the crypto asset since its January 20 all-time high of $109,300, with four attempts to defy the supply line failing flat.
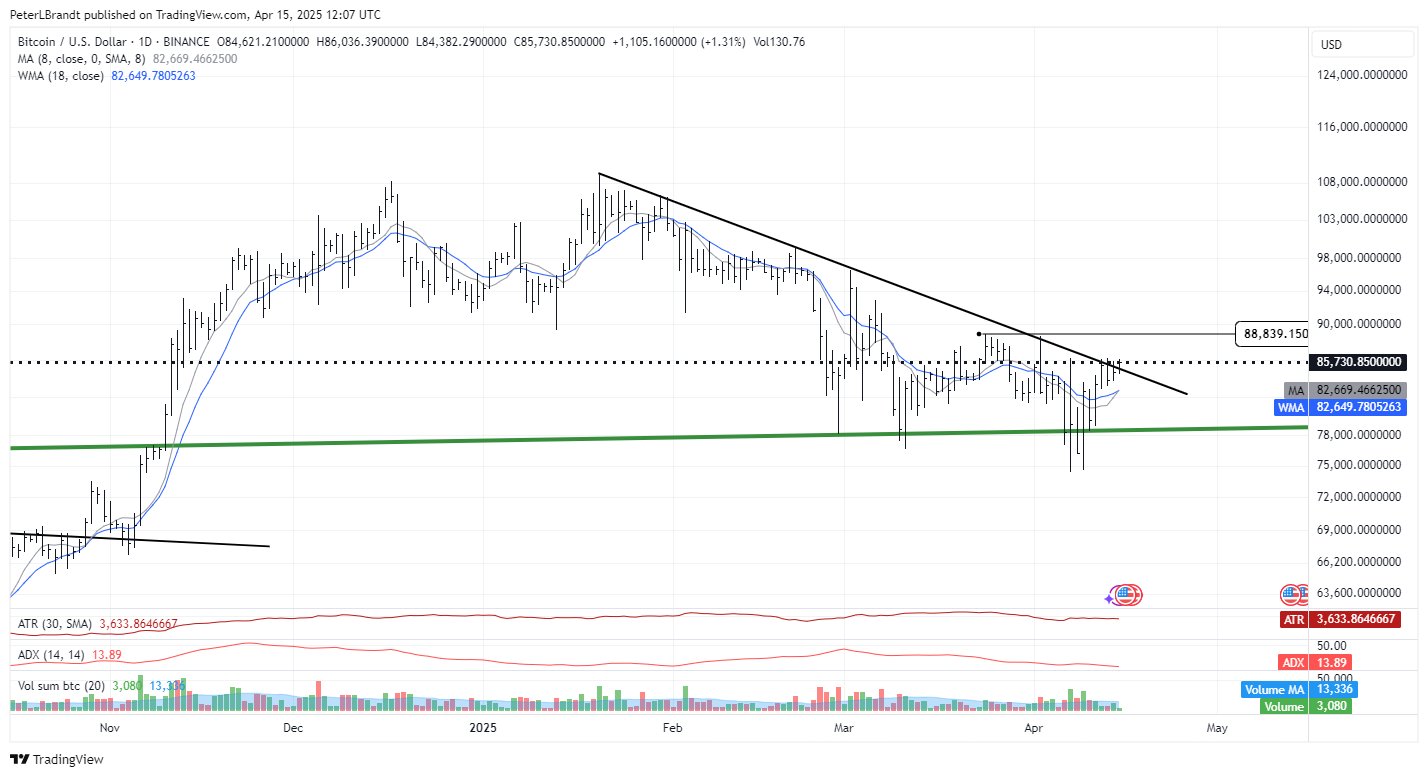
However, Bitcoin finally seems to be breaking above the trendline, inducing “hopium” among market participants. The market veteran identified this quick bullish flip and advised caution.
According to Brandt, a trendline breakout is the least significant in chart construction, insinuating that indications other than a mere resistance line need to confirm the trend transition.
Meanwhile, Brandt insisted there was more to it when queried about a similar trendline breakout that saw Bitcoin rally from around $73,000 in November to its January peak price. The expert suggested that aside from the obvious bullish fundamentals following Donald Trump’s election win, the rally came from “a well-known, well-established” price pattern.
For context, Bitcoin broke from a seven-month flag pattern formed from its earlier yearly high of $73,808 in March until late October before the price explosion to six figures.
Possible Levels to Watch
Nonetheless, Brandt’s chart highlighted crucial levels to watch out for to confirm a trend shift. If Bitcoin continues its price growth, it must break above a resistance level at $88,839 for a sustained uptrend.
However, if momentum fails to hold and Bitcoin slides, the analysis highlights a crucial support line around $78,000 as its next muster point. Notably, the crypto leader has found solace around the area multiple times in the last three months.
In the meantime, Bitcoin has faced severe rejection from $86,000, dumping to $85,145 at the time of writing.


No comments yet