


The coin continues to tease all-time high prices at $31 as bulls defend the $27 and $24 support levels. A break and close above the $28 mark could set a bullish move for the WBTUSD bulls.
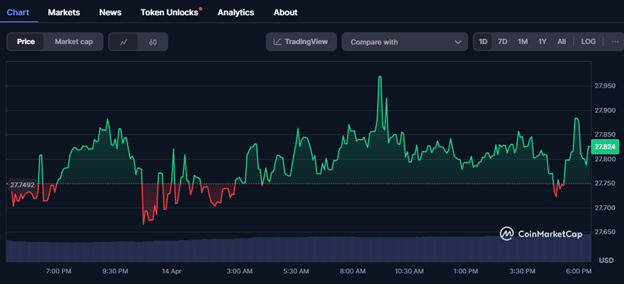
WhiteBIT Coin (WBT) trades at $27.82, as of writing on Monday 1440 hours (UTC), a slight increase of 0.32% over the past 24 hours. With a circulating supply of 365.55M WBT, the current market cap stands at over 5 billion, with a fully diluted market value of 11.2 billion USD. WBT is also currently ranking at #22 on Coindesk in terms of Market Cap
In this piece, we focus on the 2025 price prediction of the token, analysing the daily charts, 4-hour charts and short-term outlook. The article further explains the global trade-war and its effect on WBT’s price and the crypto market in general.
The 1D WBTUSD chart analysis reveals the peak of WhiteBIT Coin at $31.14 in early March 2025, followed by a correction to $27.18 by April 2, as the global markets took a tumble in reaction to “Trump’s tariffs”. WBTUSD price broke and closed above $25.05 in early January, turning resistance to key support levels.
The WBT bulls are putting efforts into crossing the $28.00 resistance as the wider crypto market slowly recovers from the recent drawdown. The price grinds higher, trading at $27.82 during the early North American session on Monday. The token sustained a hawkish outlook through the weekend, as traders let off on Saturday before resuming normal operations in the late Asian session on Sunday. This is also supported by the bullish sentiment from the 90-day tariff suspension in the United States.
WBTUSD is heavily reliant on the coin surpassing the immediate $28.00 resistance level to mark a new support for the token. However, a reversal to the $27.00 price level, or the 100-day Exponential Moving Average (EMA), could provide whales an opportunity to add more liquidity to the token, taking advantage of the drawdowns in the market.
The price of WhiteBIT is holding steady between two key levels, highlighted by the 100-day EMA at $27.00 as the higher support level and the 200-day EMA providing the lower support level at $24.03. The short-term confluence resistance is showcased by the 20-day and 20-day EMA at $28.03.
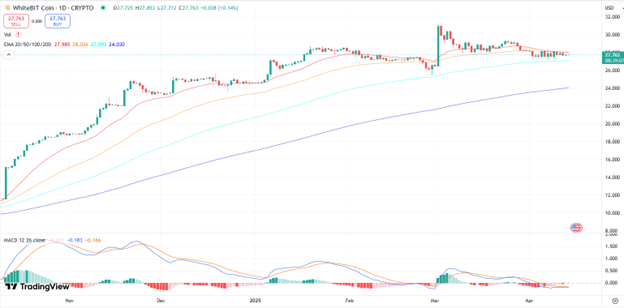
The Moving Average Convergence Divergence (MACD) shows a slight sell momentum on the coin, showing indifference in the market. However, the MACD is recovering towards the mean line, and the histograms are flipping green, affirming a possible bullish run. As the path of the least resistance clears, the coin could see it test its resistance levels at $31.14 and possibly set new all-time highs.
The Relative Strength Index (RSI) indicator is slightly below its neutral point at 46.60 but is trending higher, upholding the bullish outlook for the token. As the RSI steadies above the neutral line, it could reinforce the bullish narrative, setting the coin to test its all-time highs in the coming weeks.


No comments yet