


1. Take the opportunity to start?
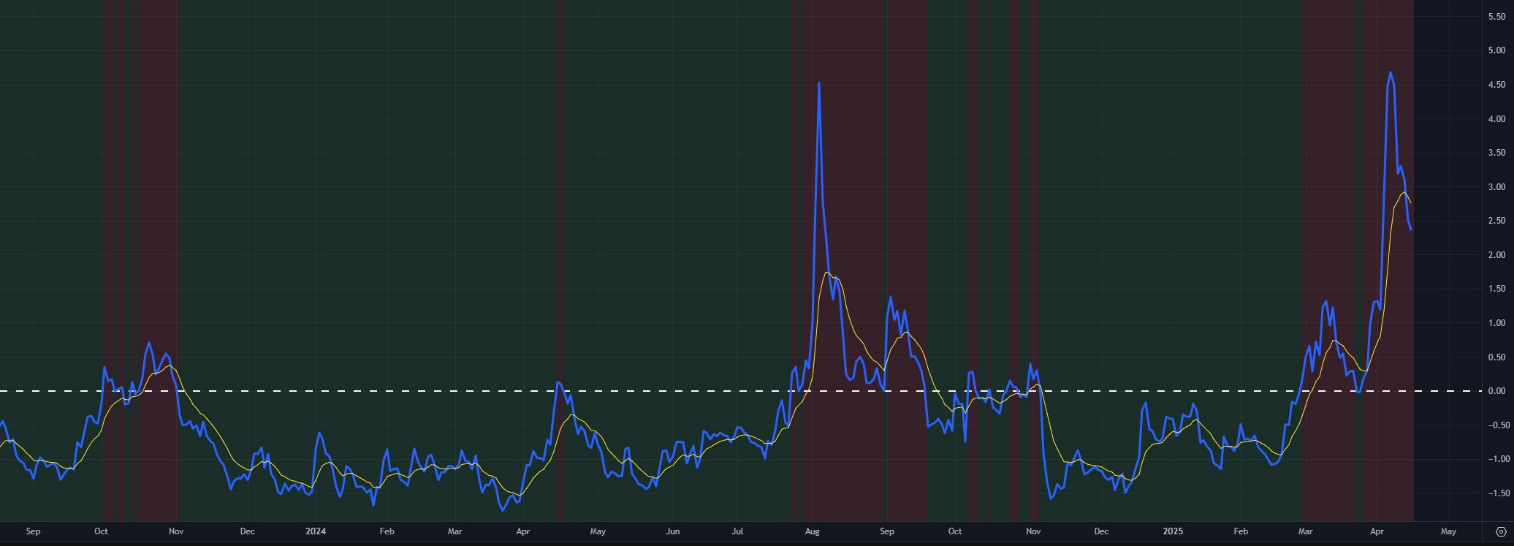
Analysts: Although financial conditions indicators have fallen, they are still in a tightening direction. For me, only if this indicator falls below zero and enters the loose range can I enter the market with more peace of mind. Of course, if you are a trader with a more radical operating style, there was actually an entry signal yesterday—The indicator falls below its 10-day moving average, which is an opportunity to "be ahead of the position".
2. Silver
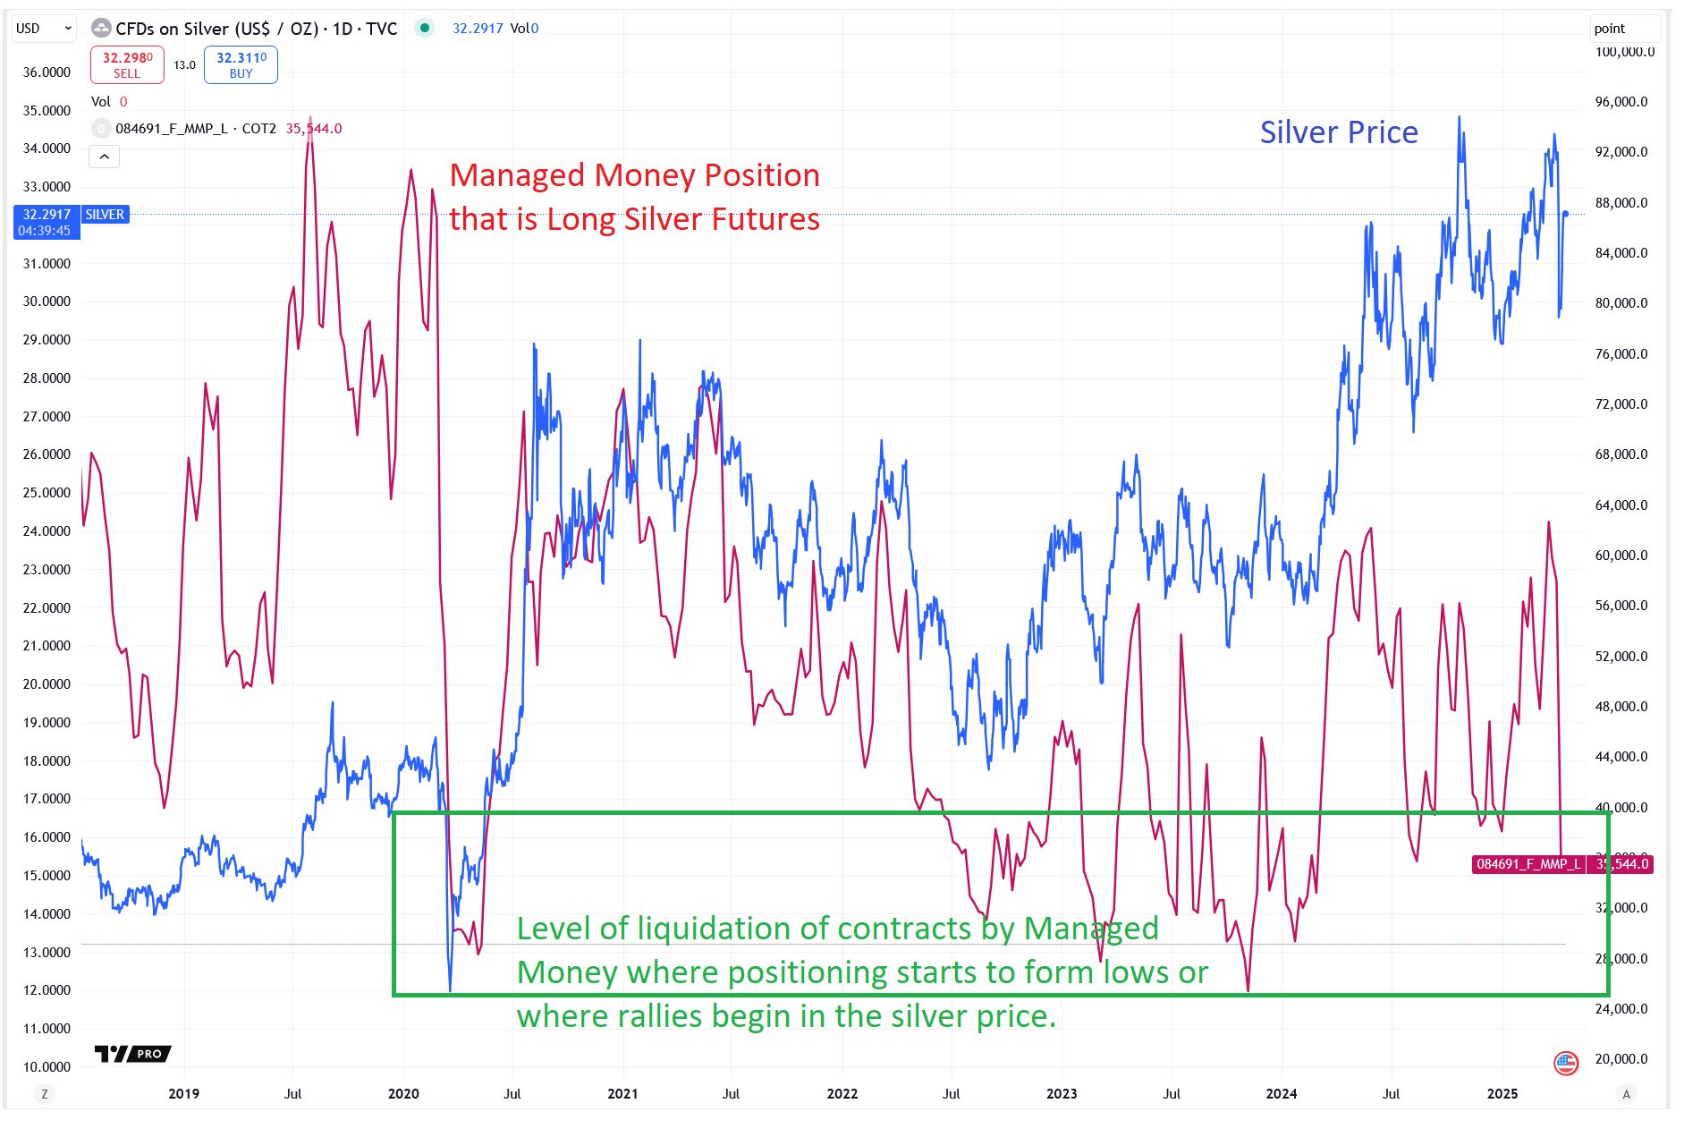
Analyst: The figure below shows the relationship between the long positions (red) of "Managed Money" (MM) in silver futures (blue). The pullback in early April, accompanied by the sharp cuts of MM bulls, brought the position volume back to the "green area" -In the past, this range was often the area where prices stopped falling, stabilized, or even began to rebound.
3. Rebound?
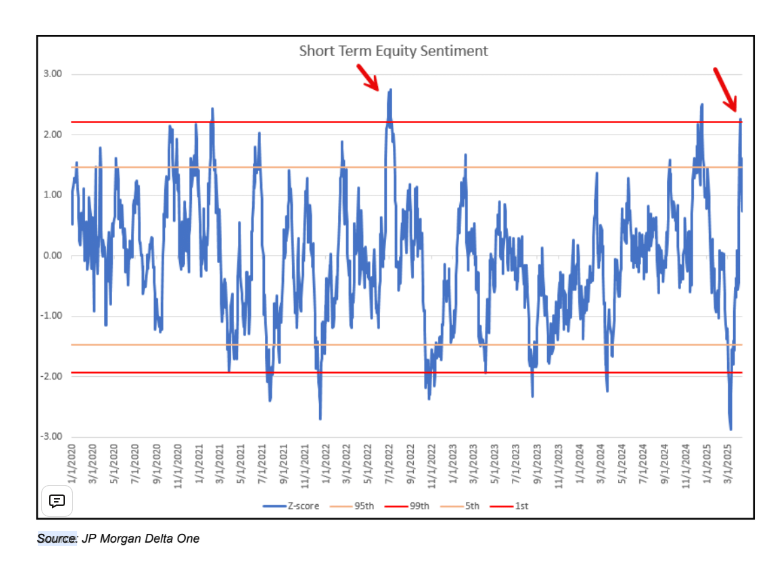
JPMorgan Chase: Our short-term stock market sentiment indicator has begun to decline after hitting the 99th percentile, indicating that market sentiment may be turning. The last time there was a similar rapid reversal was during a bear market rebound in 2022. therefore,It's time to consider building a hedging position.
4. The space for gold price
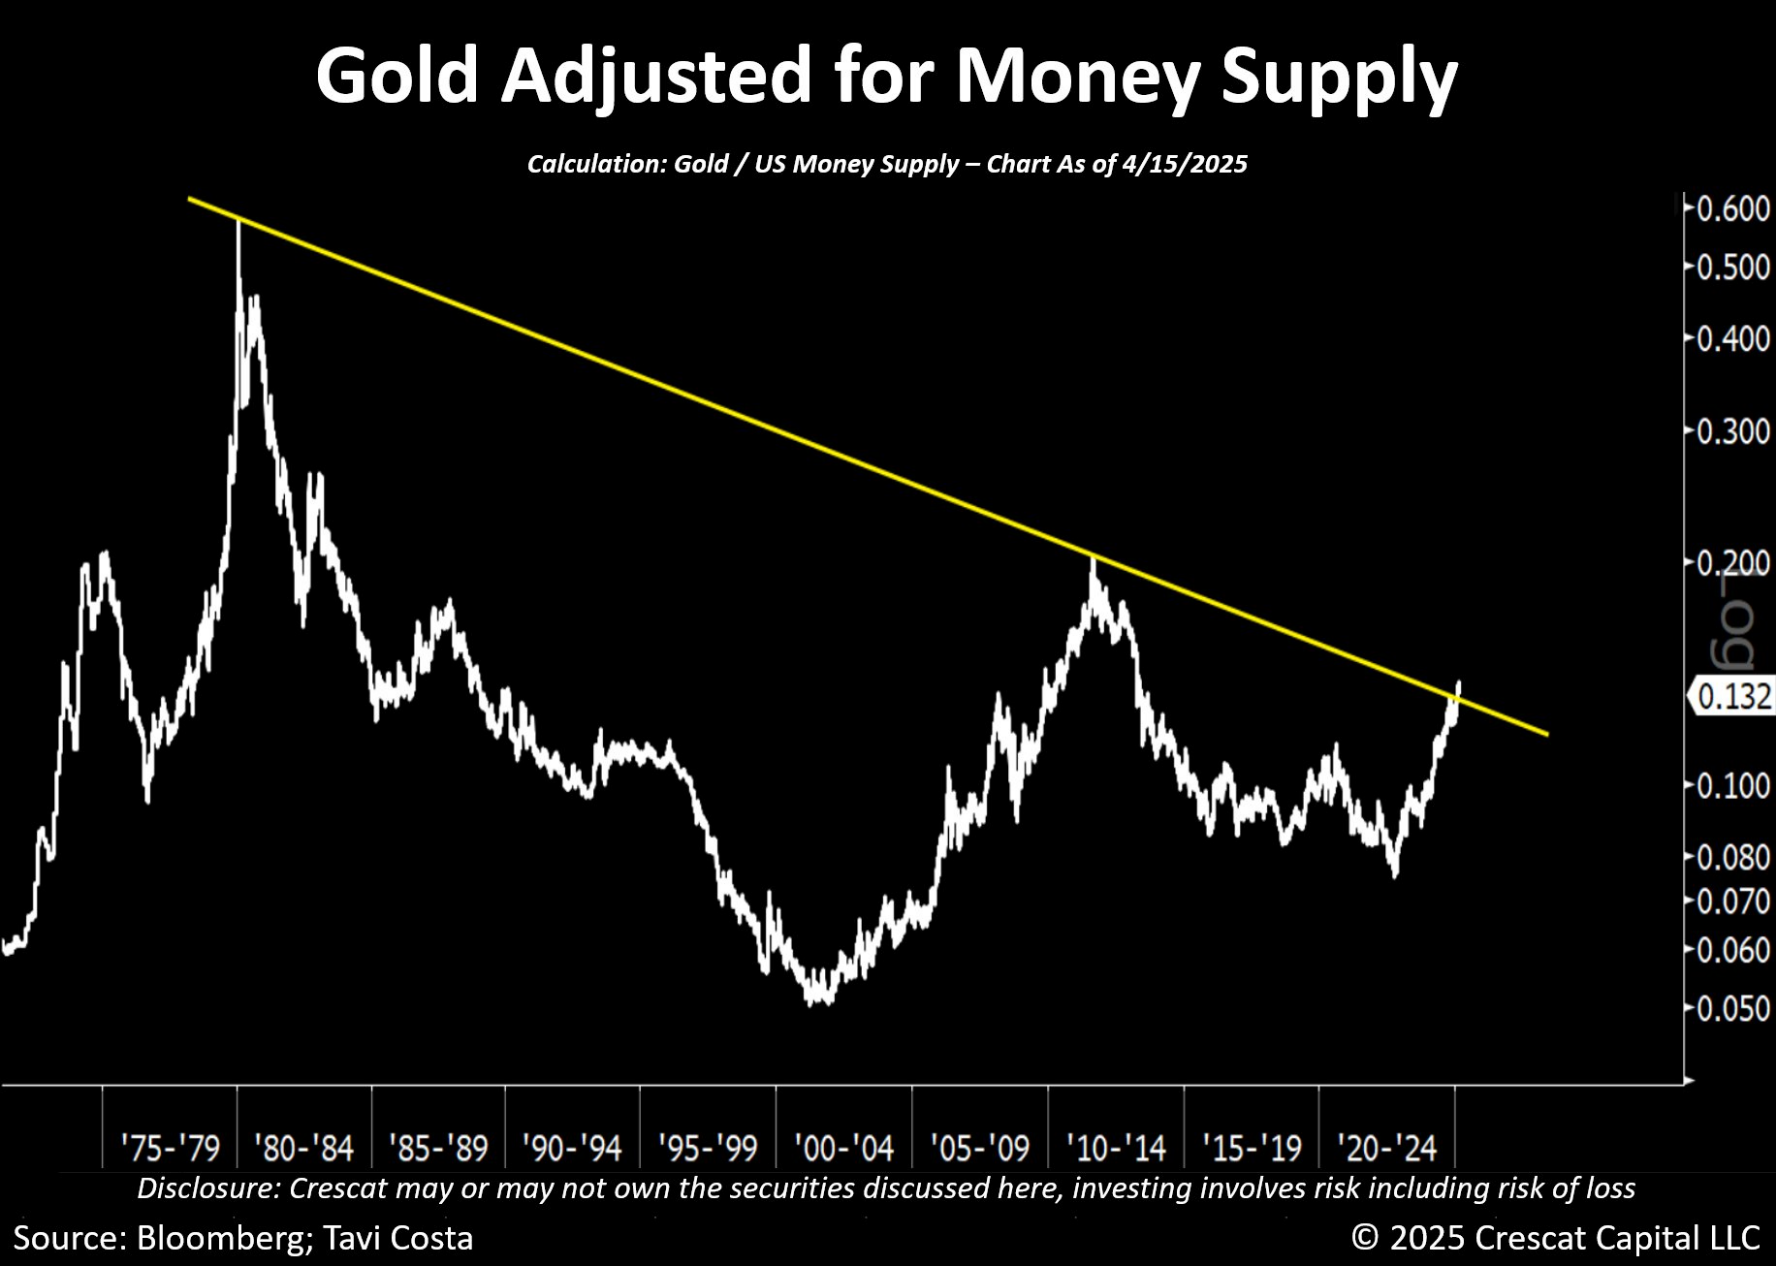
If gold prices are adjusted according to the money supply, they are still about 75% lower than the peak level in 1980.
5. The surge in gold prices
Analyst: As shown in the figure below, gold has now entered a typical market "blow-off stage".This rapid pull-up will inevitably eventually form a top, but trying to accurately touch the top is often expensive.Moreover, the trend of the spray-type top often goes far beyond the margin of short accounts.
————
The "Macro Must-see Chart" series is exclusively updated on Inner Planet Daily, and researcher Lexie screens out the "God Pictures" shared by Wall Street masters every day.Scan the code to unlock all contents of this issue (at least 15 charts per issue), enjoy the benefits of referring to the planet within one year, and take a look at the series of contents such as macro strategy analysis, professional trader sharing, and key data prospects.


No comments yet