


A widely followed crypto analyst says one Solana (SOL) competitor may be gearing up for a breakout.
In a new thread, crypto trader Michaël van de Poppe tells his 783,000 followers on the social media platform X that Sei (SEI) may increase more than 100% its current value if it breaks through a key resistance level.
“SEI starts to show momentum. The Bitcoin pair has a strong bullish divergence on the higher timeframes and the USD pair faces a crucial resistance. Breaking through $0.20 opens up a continuation towards $0.30-$0.35.”
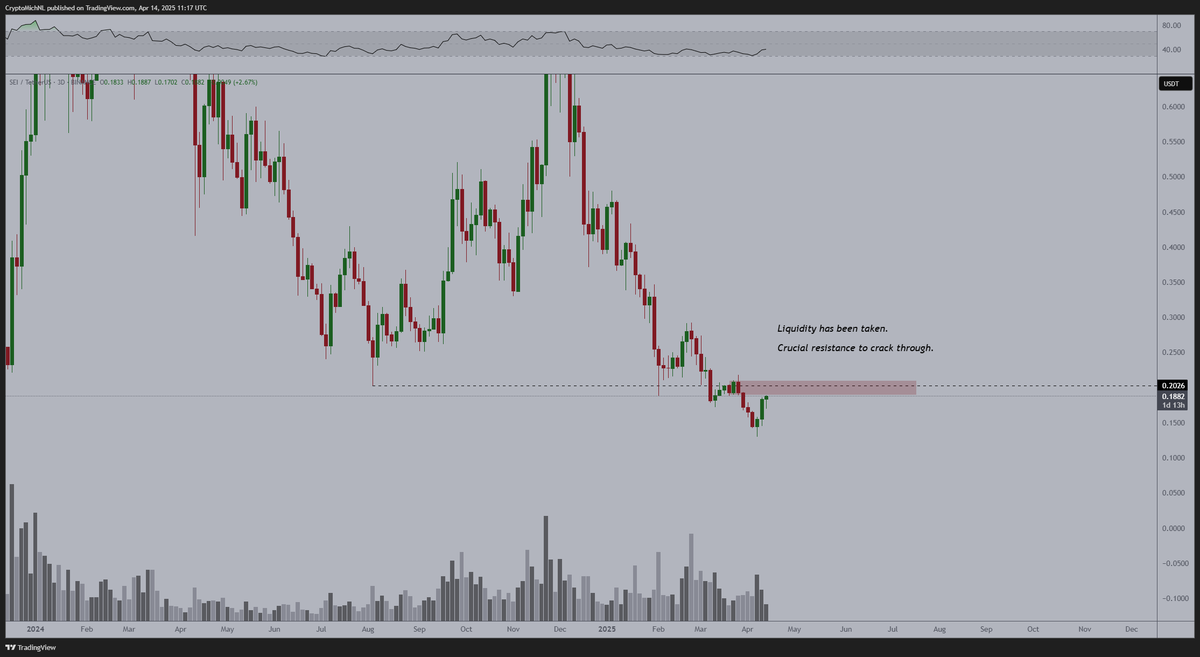
SEI is trading for $0.17 at time of writing, down 2.4% in the last 24 hours.
Next up, the analyst says that Bitcoin (BTC) is in a consolidation phase that may lead to an explosive move to the upside.
“Bitcoin is stuck in the final range. Another test of $87,000 and we’ll likely break upwards to the rally of a new all-time high.”
Bitcoin is trading for $83,800 at time of writing, flat on the day.
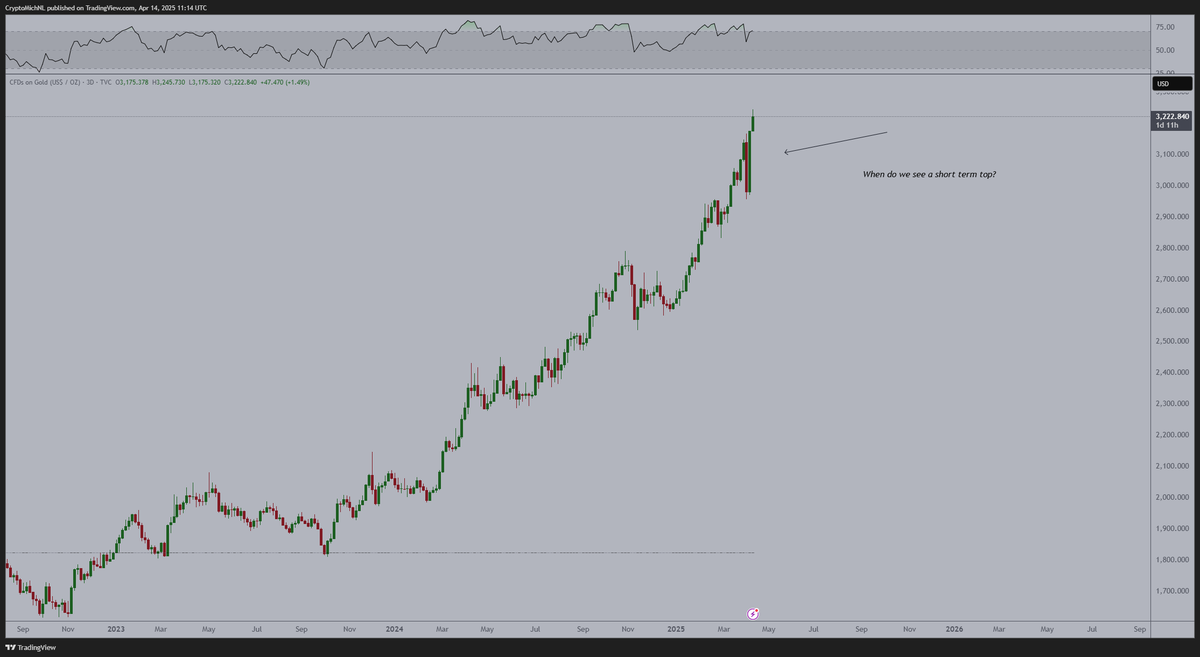
Lastly, the analyst says that Ethereum (ETH) may be kicking off an uptrend if the price of gold peaks, based on ETH’s historic inverse correlation with the precious metal.
“A good start of the week, as ETH is +4% against Bitcoin. The ultimate question whether it will sustain or not, last months it has been giving back the returns in the days after. What to monitor? Gold peaking or not. If that’s the case, then we’ll see more strength on ETH.”
The analyst also says that ETH’s Relative Strength Index (RSI) indicator is flashing bullish, having entered oversold territory.
The RSI is a momentum oscillator used to determine whether an asset is oversold or overbought. The RSI’s values range from zero to 100. A level between 70 and 100 indicates that an asset is overbought. The 0 to 30 level range indicates that an asset is oversold.
“It’s been a bear market for 1,225 days for ETH, as, in this period, gold did a 2x. The lowest RSI on the weekly candle for ETH as well.”
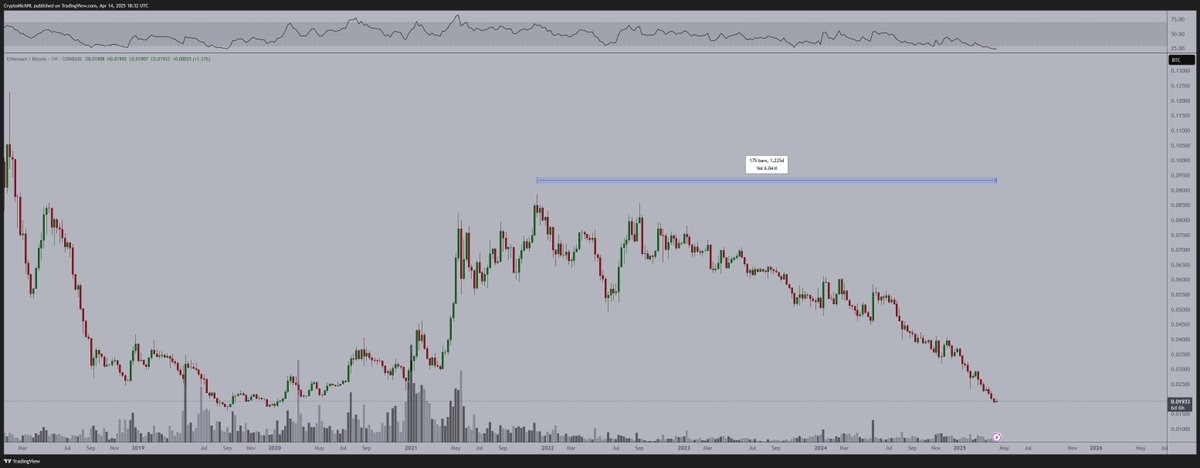
ETH is trading for $1,589 at time of writing, down 2% in the last 24 hours.
Follow us on X, Facebook and TelegramDon't Miss a Beat – Subscribe to get email alerts delivered directly to your inbox
Check Price Action
Surf The Daily Hodl Mix
Generated Image: Midjourney


No comments yet