


A widely followed crypto analyst says Bitcoin (BTC) may be on the verge of a massive bullish reversal after correcting into the $70,000 range.
Closely followed strategist Credible Crypto tells his 466,700 followers on the social media platform X that Bitcoin may be printing a bullish triple-bottom reversal pattern on the four-hour chart.
A triple-bottom pattern indicates that an asset has found a strong price floor that refuses to crack even after being tested three times.
“If this triple tap actually holds, it will be the most epic/legendary bottom ever.”
However, the analyst warns that if Bitcoin fails to hold $78,264 as support, the flagship crypto asset may next drop by as much as 13% from its current value.
“There’s our re-test of range lows. We need to hold here or else $69,000-$74,000 officially comes into play.”
Bitcoin is trading for $80,641 at time of writing, up nearly 2% on the day.
Next up, the analyst says that Ethereum (ETH) may revisit the $1,100 level if BTC starts correcting further.
“Unfortunately, most alts (including ETH) haven’t held up very well on this drop and so a further push down on BTC to our second zone [$69,000-$74,000] likely means ETH will break below the region I expected to mark our bottom (GREEN).
If that happens, the only other area of interest I can see on the downside is the ORANGE zone below. Keep in mind our HTF (high timeframe) horizontal support at $1,800-ish remains valid until the close which is at the end of this month. So if we do get a break on BTC to $69,000-$74,000 and on ETH to the orange zone, I would want to see a strong buyback and push back above $1,800-$1,900 by the monthly close.
I don’t think you can go wrong buying spot into the ORANGE zone for a mid/long-term hold…”
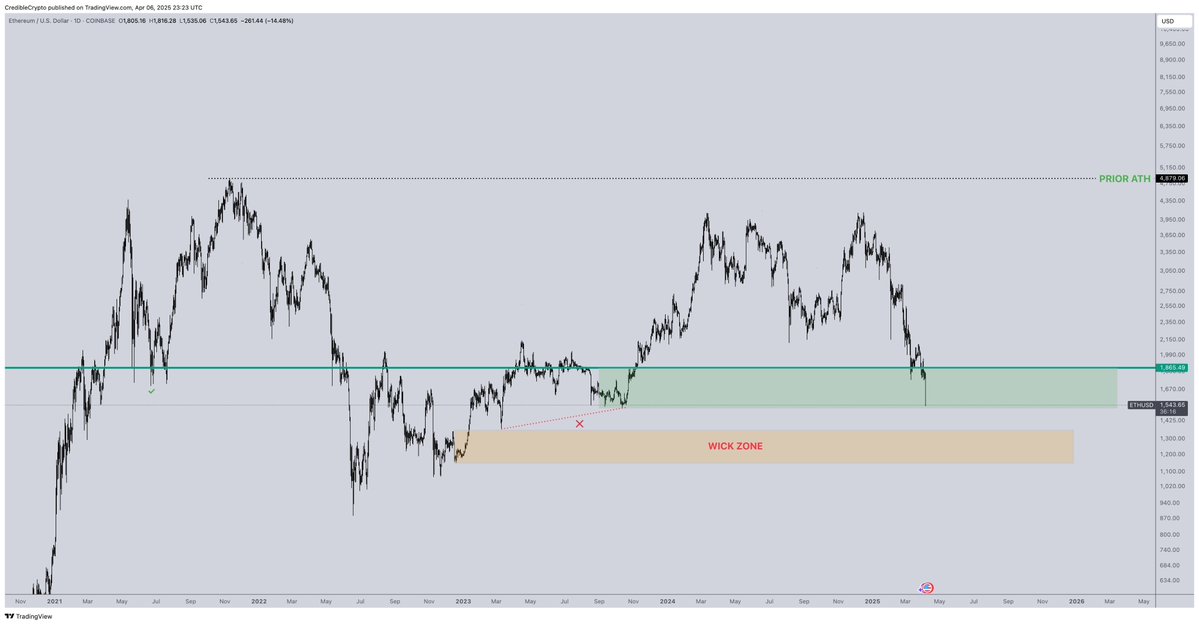
Ethereum is trading for $1,568 at time of writing, down 1.3% in the last 24 hours.
Lastly, the analyst says that payments token XRP may temporarily dip below $1.80 before rallying to a new all-time high of around $3.50.
“Check my chart: I’m not expecting a breakdown below $1.80. I’m expecting a deviation below it, aka a false breakdown or fake out below it, before the next leg up. It would not be a sign of weakness if we visit sub $1.80 basically.”
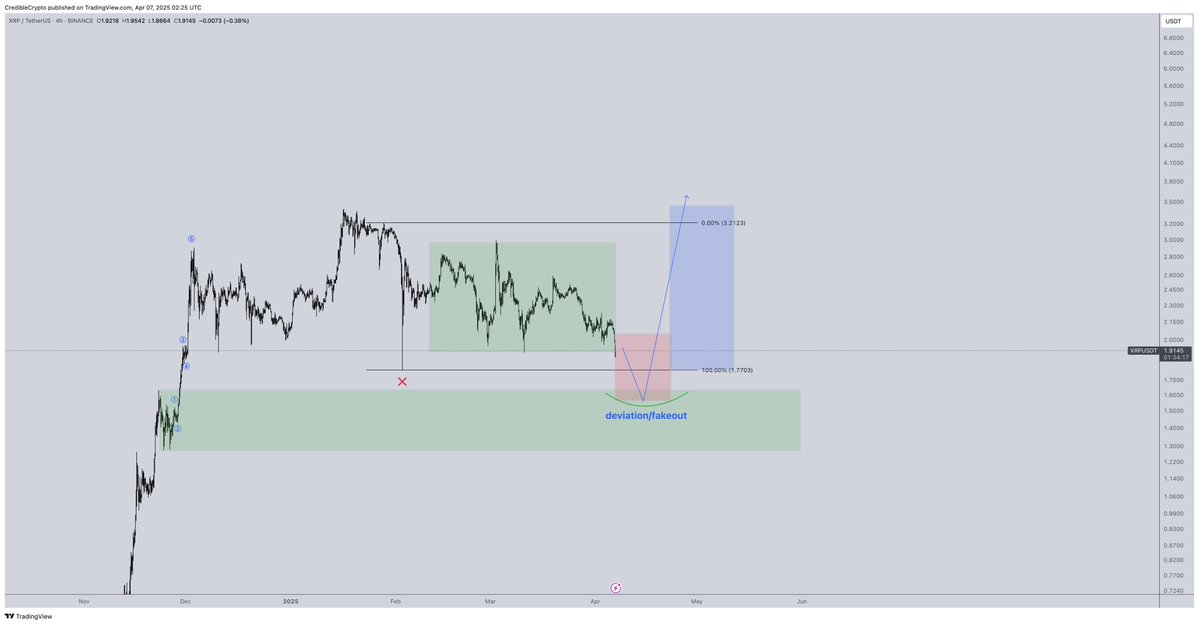
XRP is trading for $1.93 at time of writing, down 1.8% on the day.
Follow us on X, Facebook and Telegram
Don't Miss a Beat – Subscribe to get email alerts delivered directly to your inbox
Check Price Action
Surf The Daily Hodl Mix
Generated Image: Midjourney


No comments yet