


Original title: Tariffs and Turmoil
Original author: UkuriaOC, CryptoVizArt, Glassnode
Original translation: Daisy,
The Trump administration announced the "Liberation Day" tariff policy, which caused violent fluctuations in the financial market, and the major macro indexes generally fell, and the digital asset market was not spared, showing a comprehensive decline.
summary
· News of the U.S. tariffs have seriously disrupted major global financial markets, with multiple markets experiencing one of the worst trading days since March 2020.
· The inflow of capital to digital assets has almost stagnated, and liquidity has contracted sharply, bringing strong downward pressure.
· However, judging from the price trends of Bitcoin and Ethereum, as prices fall, the scale of loss escape gradually decreases, which may indicate that the market's selling pressure is tending to exhaust in the short term.
· The decline in the entire digital asset market is widespread.
· The altcoin market value has dropped from $1 trillion in December 2024 to $583 billion now.
· Comprehensive analysis of on-chain and technical models shows that to regain the uptrend momentum, Bitcoin must re-establish $93,000.
· The $65,000 to $71,000 below is the key support that bulls must hold.
The market fell across the board
The Trump administration announced the "Liberation Day" tariff policy, which triggered violent volatility in the financial market and major stock indexes generally fell. The U.S. policy stance has turned to push the dollar weaker, interest rates lower, oil prices fall and fiscal spending shrinking. These factors combined may lead to a significant slowdown in the U.S. economy and trigger a significant contraction in overall liquidity.
The uncertainty brought about by tariffs has become the fuse for the rising market's "risk-averse" sentiment, triggering a large-scale sell-off, with multiple major financial indices recording their worst performance since March 2020.
Source: Yahoo Finance
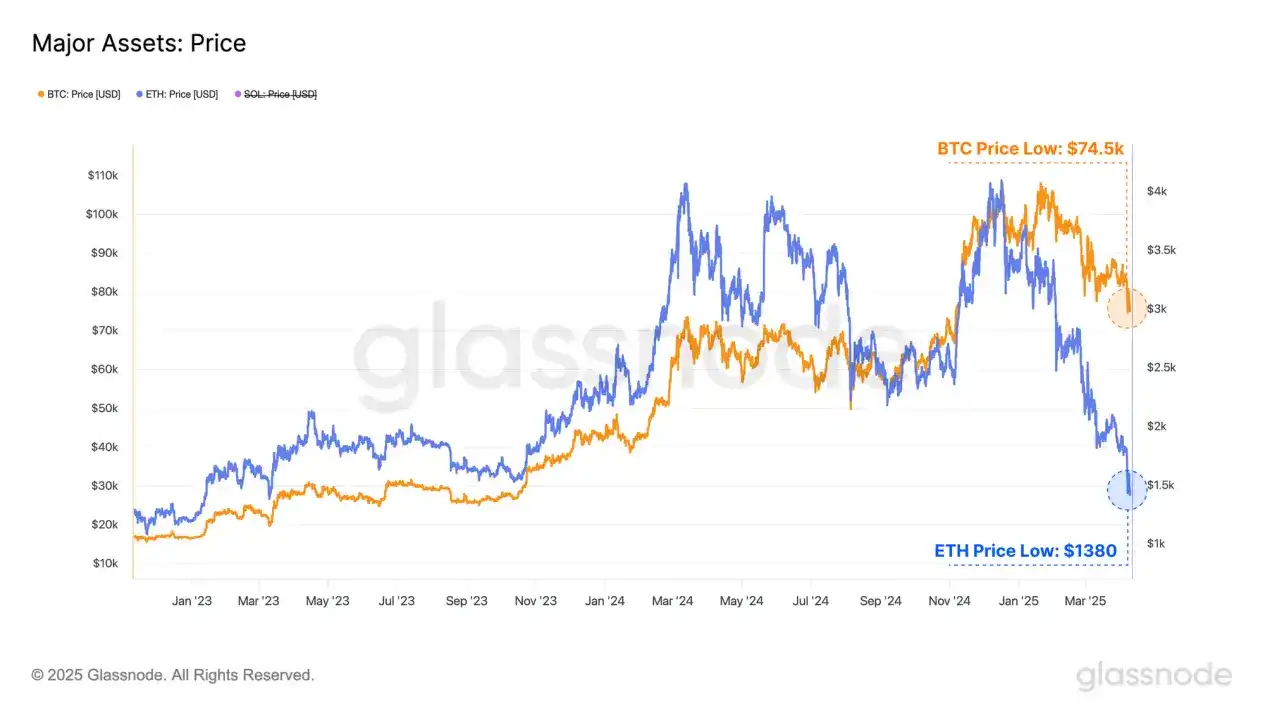
The digital asset market is particularly sensitive to changes in global liquidity and has also failed to survive this round of decline, with the prices of many crypto assets falling by double-digits.
Bitcoin, the dominant asset, fell from $83,500 to $74,500, with its market capitalization evaporated by about $150 billion.
Ethereum, the second largest crypto asset, fell even more drastically, with price dropping from $1,800 to $1,380 and a market value drop of about $40 billion.
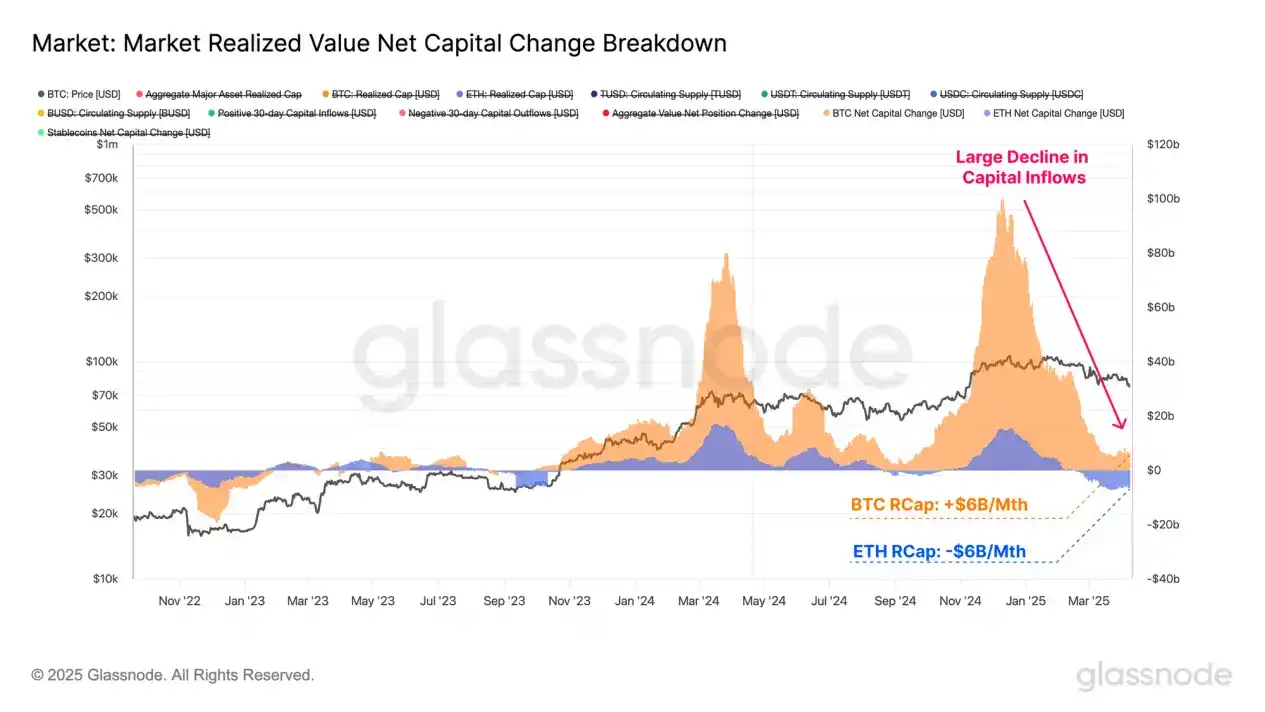
Since the beginning of the year, net inflows of funds from the two mainstream crypto assets have decreased significantly. This trend is mainly reflected in the 30th-day "realized market capitalization" changes, which measure changes in asset net capital flows.
· Bitcoin’s monthly inflow peaked at $100 billion, and has now contracted to about $6 billion;
· Ethereum’s monthly inflow peaked at $15.5 billion, and currently converts to a net outflow of $6 billion.
The inflow of funds to the Bitcoin network is gradually stagnating, indicating that the market lacks new incremental funds to support higher prices. Ethereum's capital outflow is mainly due to the fact that ETH bought at high levels is spent at low levels, thus achieving capital losses. This also shows that Ethereum currently faces greater resistance than Bitcoin and its market performance is relatively weaker.
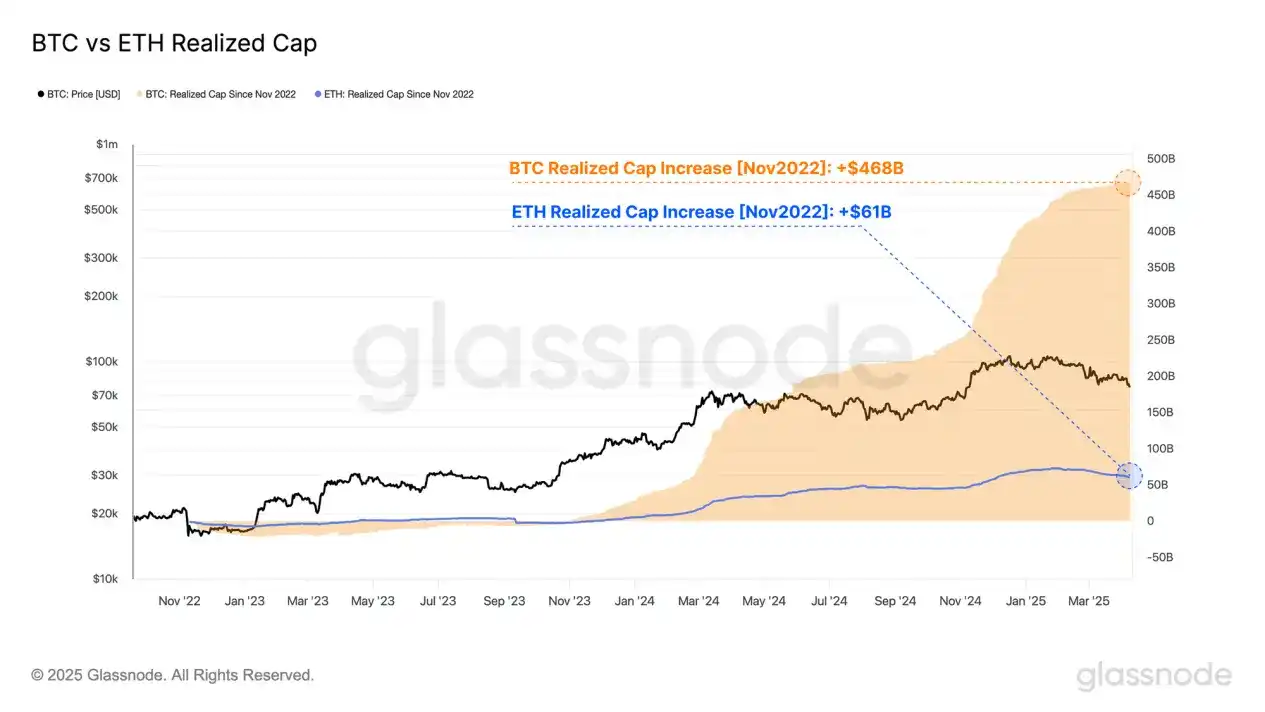
If we start with the FTX crash at the end of 2022 and observe the overall changes in Bitcoin and Ethereum's "realized market value", we can quantify the scale of capital absorbed by these two assets since the lows of this cycle.
Bitcoin’s achieved market value increased from $402 billion to $870 billion, an increase of $468 billion, an increase of 117%; Ethereum’s achieved market value increased from $183 billion to $244 billion, an increase of $61 billion, an increase of 32%.
The gap in capital inflows between the two partially explains the differentiation in the performance of the two major asset markets since 2023. Ethereum has attracted significantly less capital and new demand than Bitcoin in this cycle, resulting in its relatively weak price increase and failed to hit a new high, while Bitcoin has exceeded the $100,000 mark in December 2024.
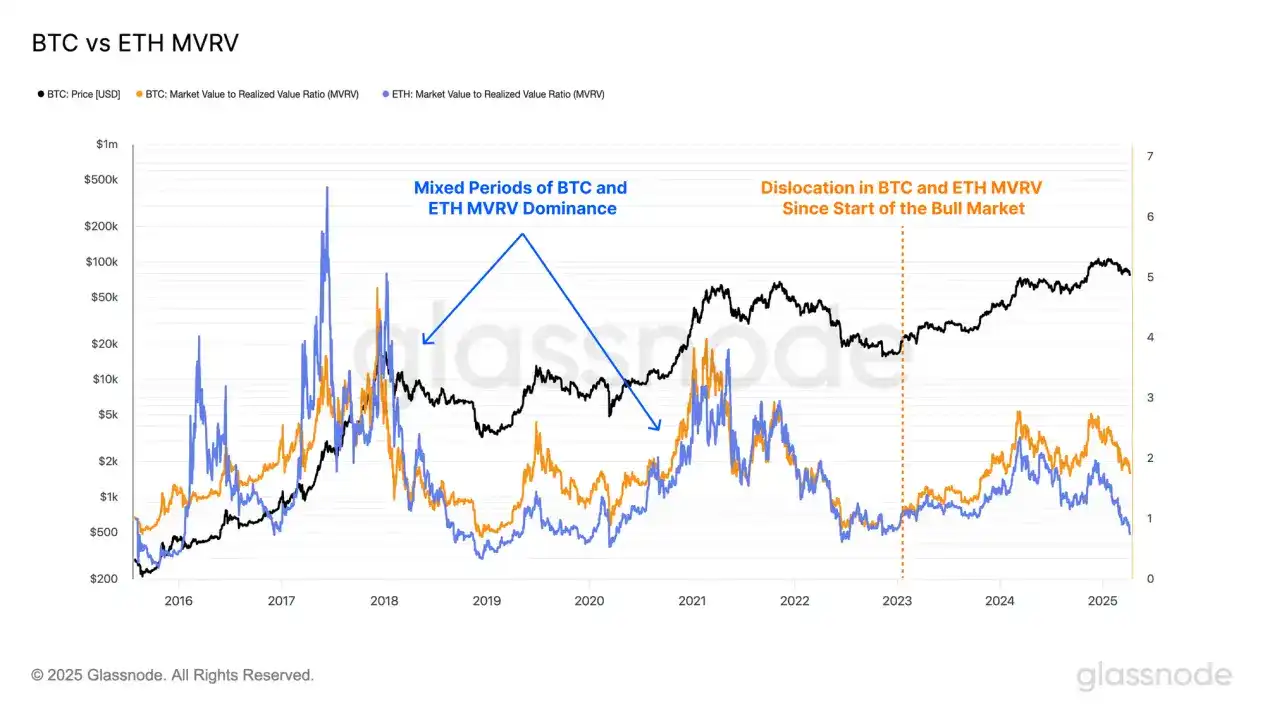
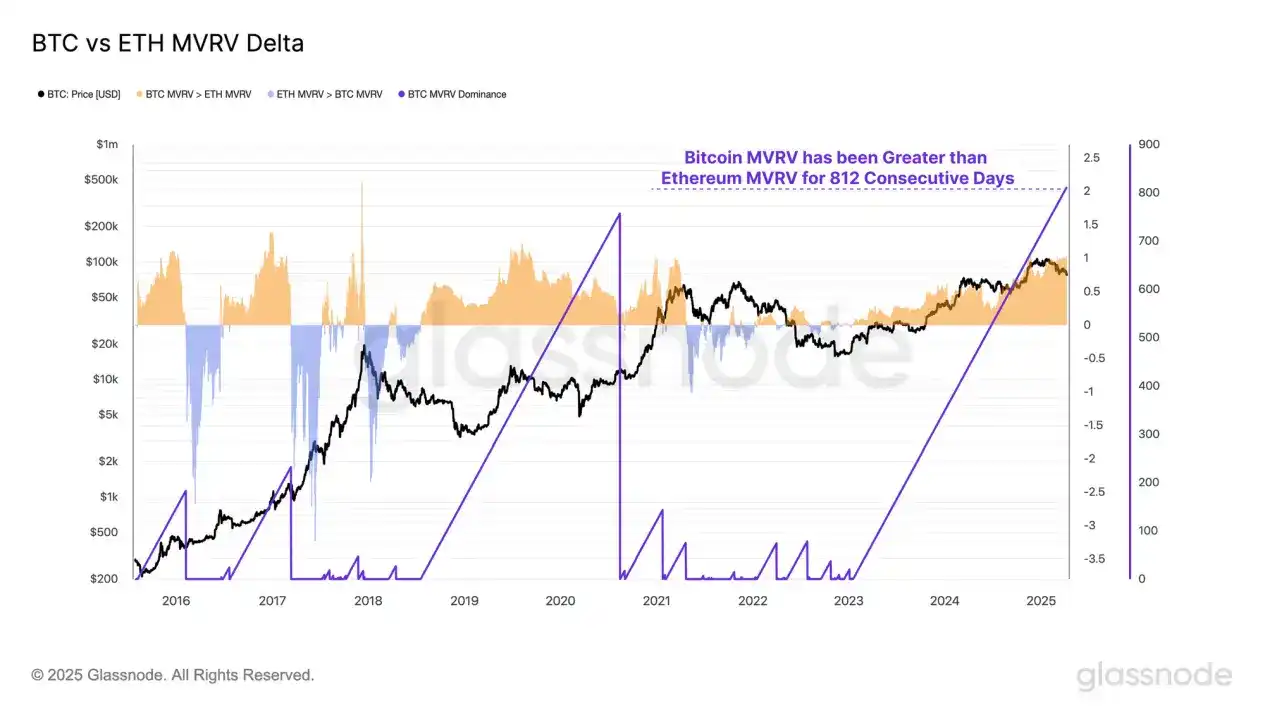
The MVRV ratio is used to measure the relationship between the spot price and the realized price, reflecting the average degree of floating profit or floating loss for each asset holder. When the MVRV ratio is higher than 1, it means that the average is in a floating profit state; if it is lower than 1, it means that it is in a floating loss state.
Since the start of this bull market in January 2023, the MVRV ratio between Bitcoin and Ethereum has once again shown significant differentiation. Bitcoin investors have always held higher floating profits, while Ethereum's MVRV ratio fell below 1.0 again in March this year, indicating that most coin holders have entered the loss range.
By calculating the difference between Bitcoin and Ethereum MVRV ratio, we can identify whether the book gains of Bitcoin holders are better or worse than those of Ethereum holders in certain periods.
A positive difference indicates that the average floating profit held by Bitcoin investors is higher than that of Ethereum investors; a negative difference indicates that Ethereum investors have stronger average profitability.
As mentioned earlier, since the start of this bull market, the average profit level of Bitcoin investors has been higher than that of Ethereum investors.
As of now, the trend has lasted for 812 days, the longest duration on record.
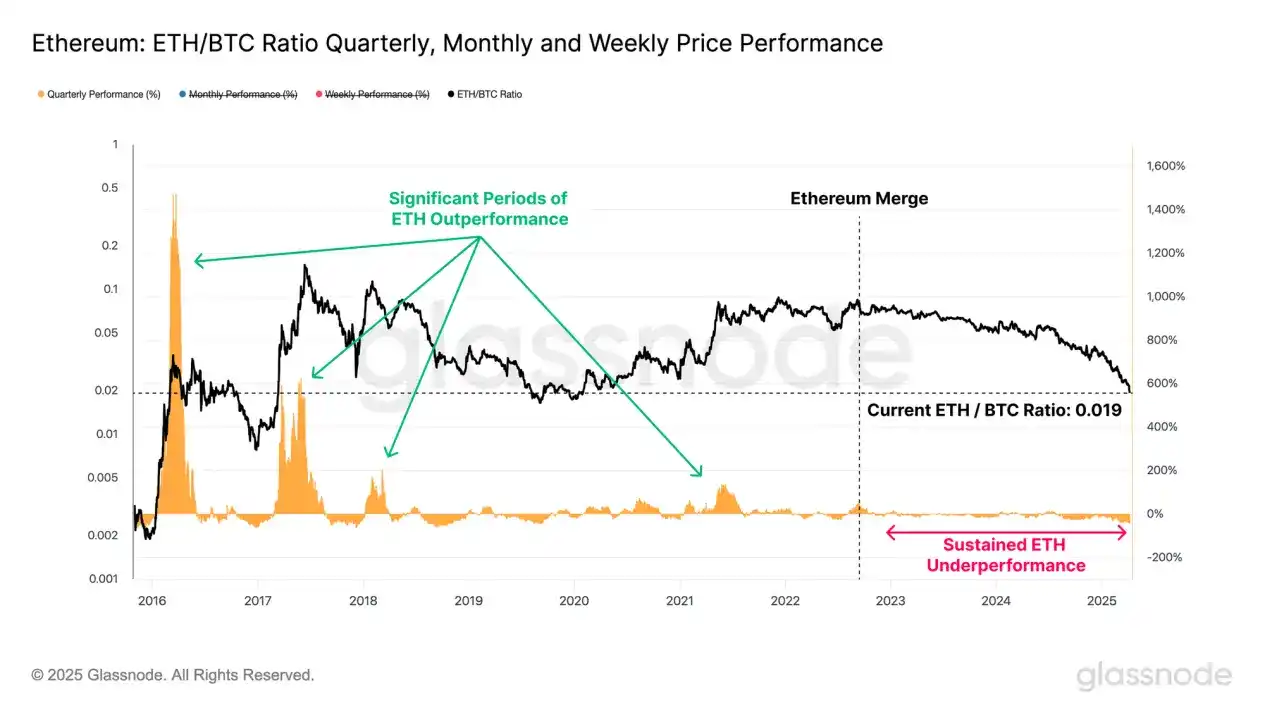
It can be seen that Ethereum's performance in this round is relatively weak, mainly because the inflow of funds and investment demand is significantly smaller than that of Bitcoin. The differentiation trend between the two can be further reflected through the ETH/BTC price ratio.
Since the "merger" upgrade in September 2022, the ETH/BTC exchange rate has dropped sharply from 0.080 to the current 0.0196, a drop of up to 75%. This is the lowest level of the pair since January 2020, with only 500 days of the 3531 trading days below the current level.
In addition, there is almost no stage in this bull market where Ethereum continues to outperform Bitcoin, which is extremely rare in the past bull market, and further shows that the market structure of this cycle has clearly deviated from the historical laws and performance patterns that investors are familiar with.
Review the loss situation
After a sharp decline like this week, it is particularly important to examine investor responses, especially in the context of rising panic and large-scale losses in bear markets.
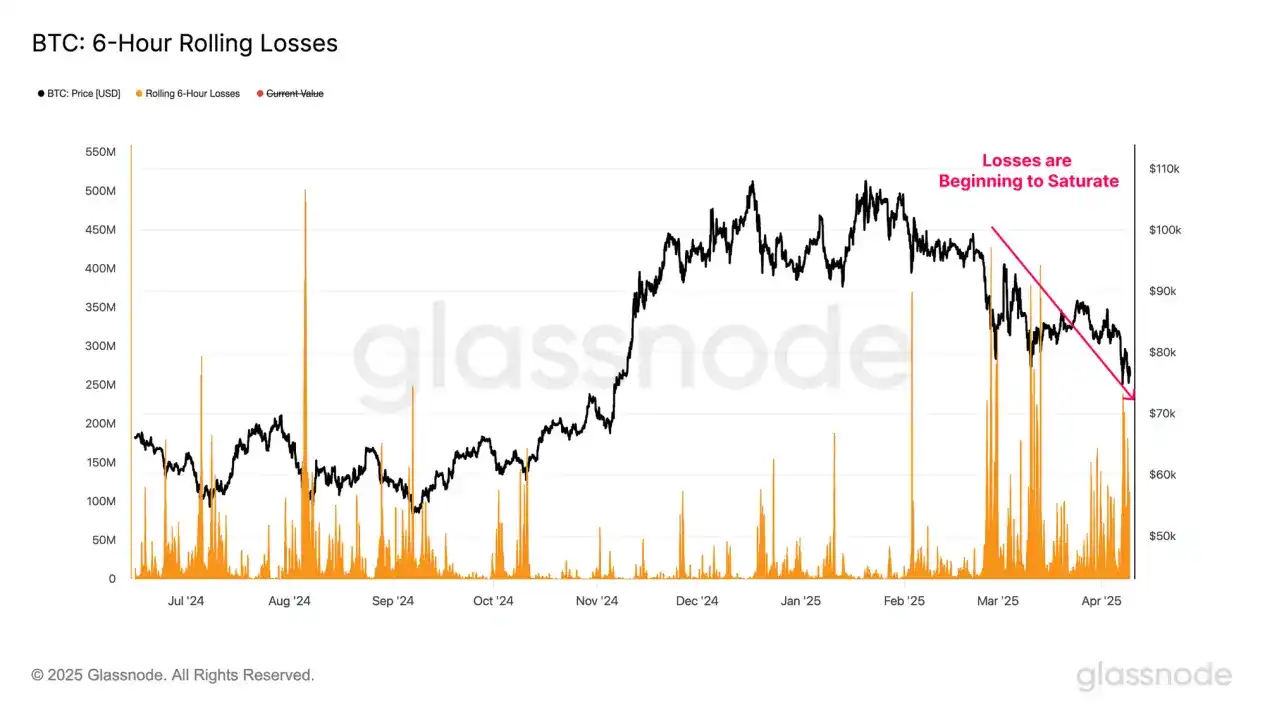
By evaluating the realized losses in the 6-hour rolling window, we can better understand the behavior and emotional reactions of market participants in the current downward trend.
The "surrender-style sell-off" event by Bitcoin investors is relatively large, with a peak loss in a certain 6-hour window of up to US$240 million, close to one of the largest loss events in this cycle.
However, as the price drops, the scale of the loss has been gradually shrinking, indicating that within the current price range, the market may show signs of short-term selling pressure exhaustion.
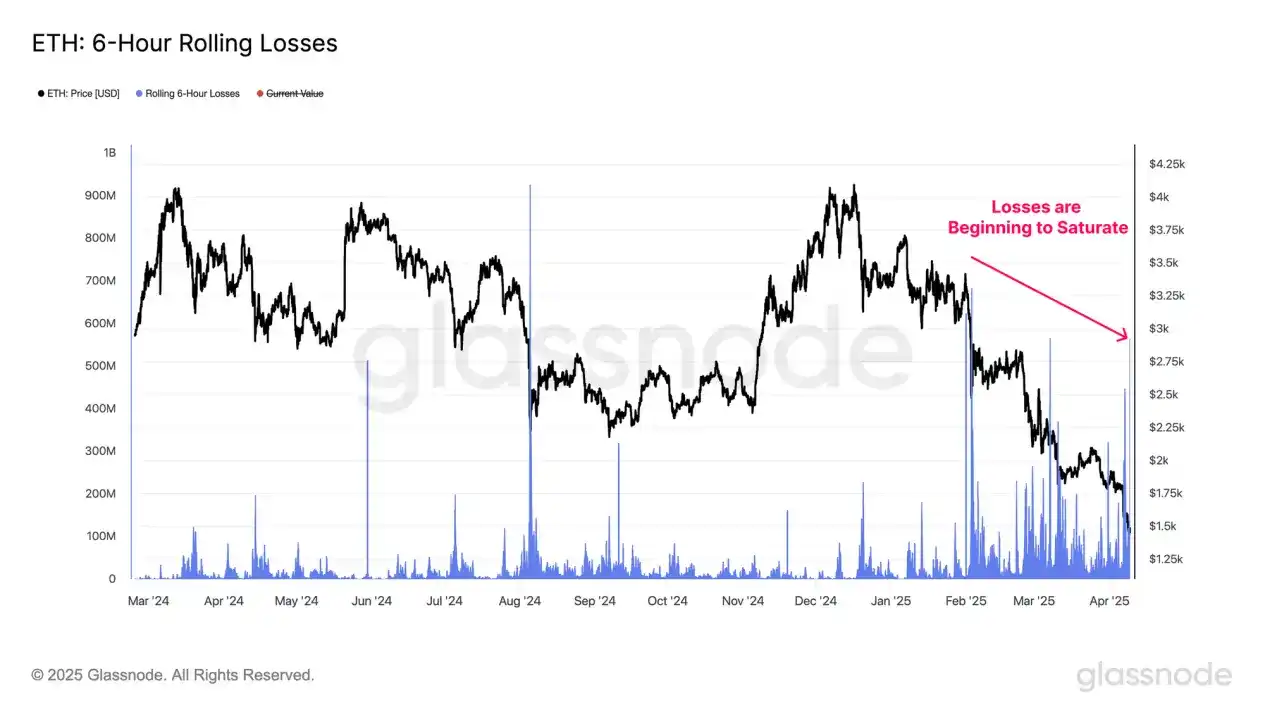
Ethereum also showed a similar behavior pattern. During this round of decline, its single loss peaked at $564 million, becoming one of the largest sell-off events since the bull market began in January 2023.
As prices gradually fall, both Bitcoin and Ethereum’s realized losses are weakening, which may indicate that investors are gradually adapting to the lower price range and the current turbulent market environment.
The market contracts across the board
The current continued tightening of market liquidity has triggered a significant depreciation of the entire altcoin sector. Assets further off the risk curve are particularly sensitive to liquidity shocks, usually accompanied by more intense price retracement.
As of December 2024, the overall market capitalization of altcoins (excluding Bitcoin, Ethereum and stablecoins) peaked at $1 trillion in this cycle. The market value has since fallen sharply and has now fallen to $583 billion, down more than 40% in just a few months.
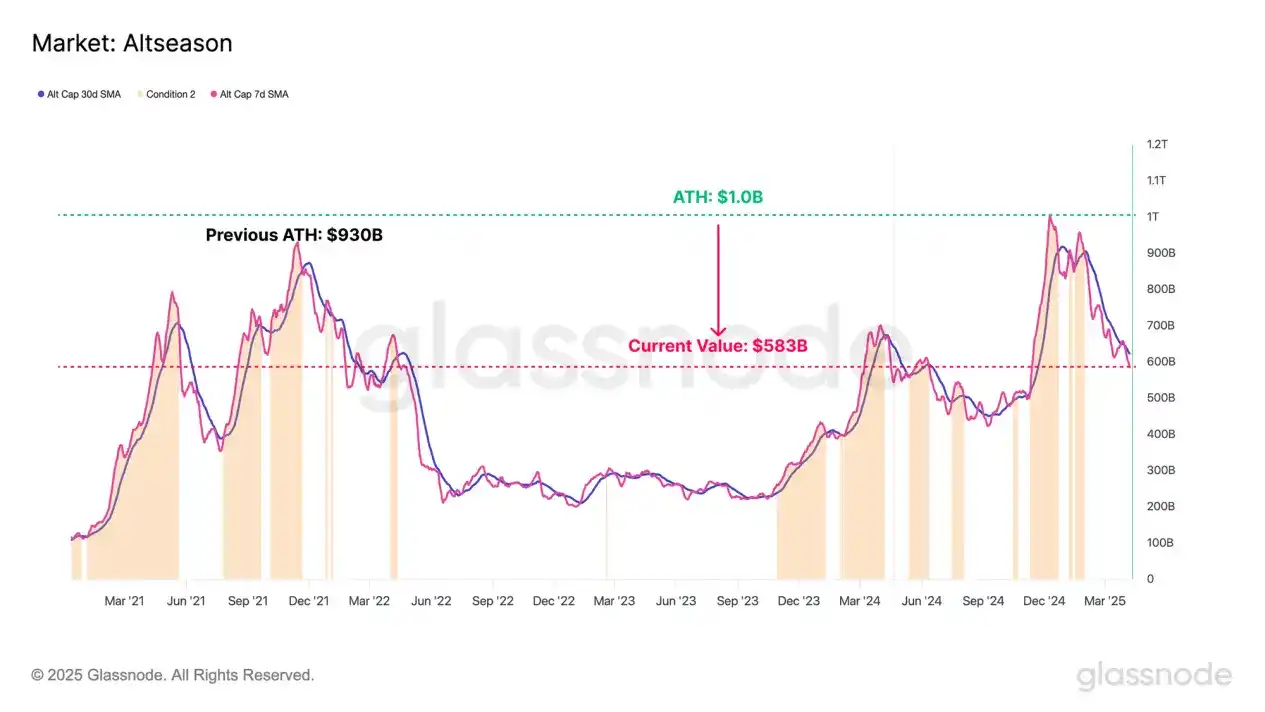
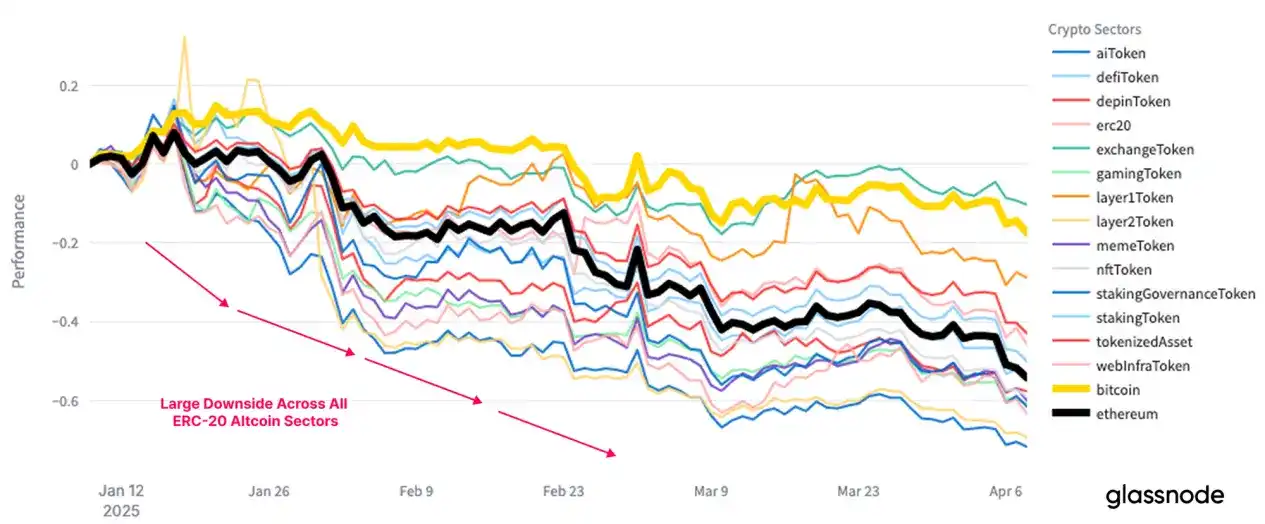
It is worth noting that in this round of reincarnation, the sub-sectors of the altcoin sectors did not show obvious differentiated trends. The overall decline is broad, with all sub-sectors depreciating significantly, and even Bitcoin has recorded negative returns in the past three months.
Range analysis
Finally, we will evaluate the market's response to key technical indicators and on-chain cost ranges. These reference tools help investors make judgments and decisions in a volatile and uncertain market environment.
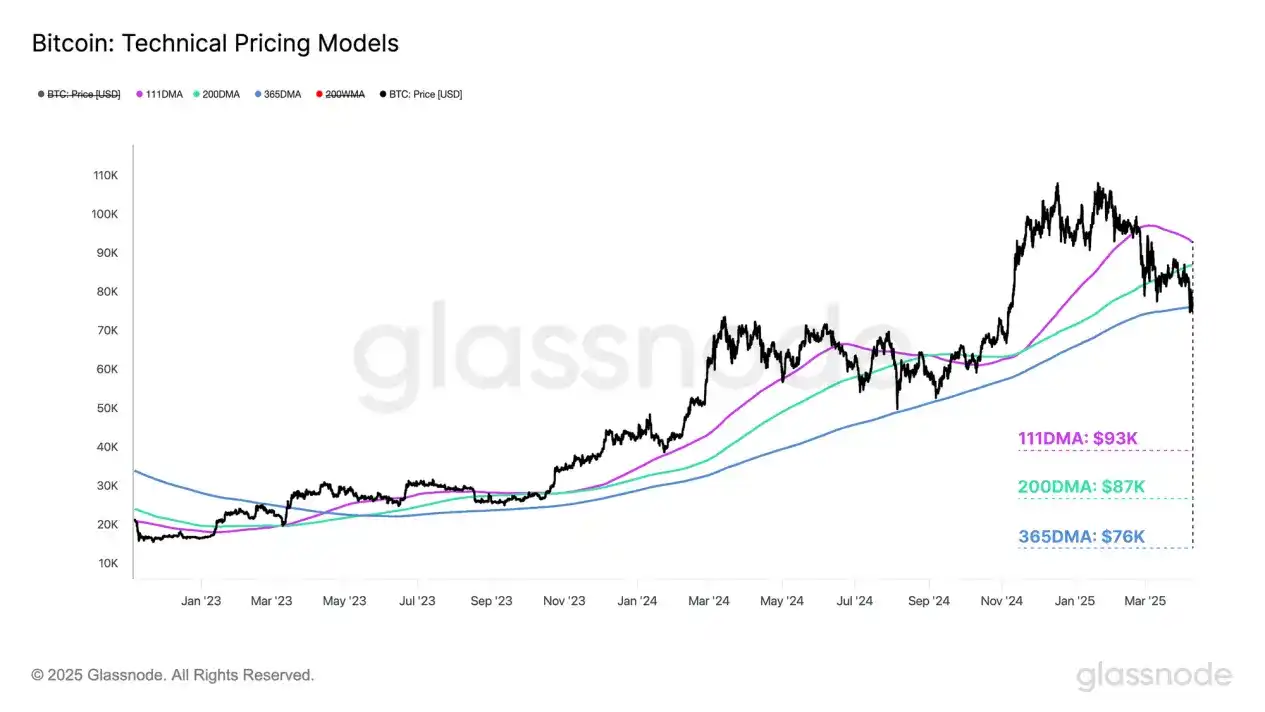
Technical analysis has long been an important tool for investors, and Bitcoin investors often focus on a key set of moving averages. Among them, the 111th day, 200th day and 365 day moving averages (111DMA, 200DMA, 365DMA) are common indicators for measuring the momentum of the Bitcoin market.
The following technical framework can be used for analysis:
Bitcoin’s first break below the 111-day moving average ($93,000) marks a major blow to market momentum, and there was no effective rebound attempt afterward.
After the first decline, the price fluctuated around the 200-day moving average ($87,000), a level seen by most technical analysts as the long-short dividing line. The market showed obvious hesitation in this range, which eventually led to another downward trend and started a new round of price decline.
Recently, for the first time, the price has fallen below the 365-day average ($76,000) since the 2021 cycle. This key momentum support level has not been completely lost yet. If it cannot continue to stand firm, it may trigger a further downward trend.
In the bull market upward phase, short-term holders (STHs) are usually the group that bear the main losses in the market panic selling. Their behavior and emotions can be used as an important reference indicator for evaluating the intensity of market pullbacks and how investors respond.
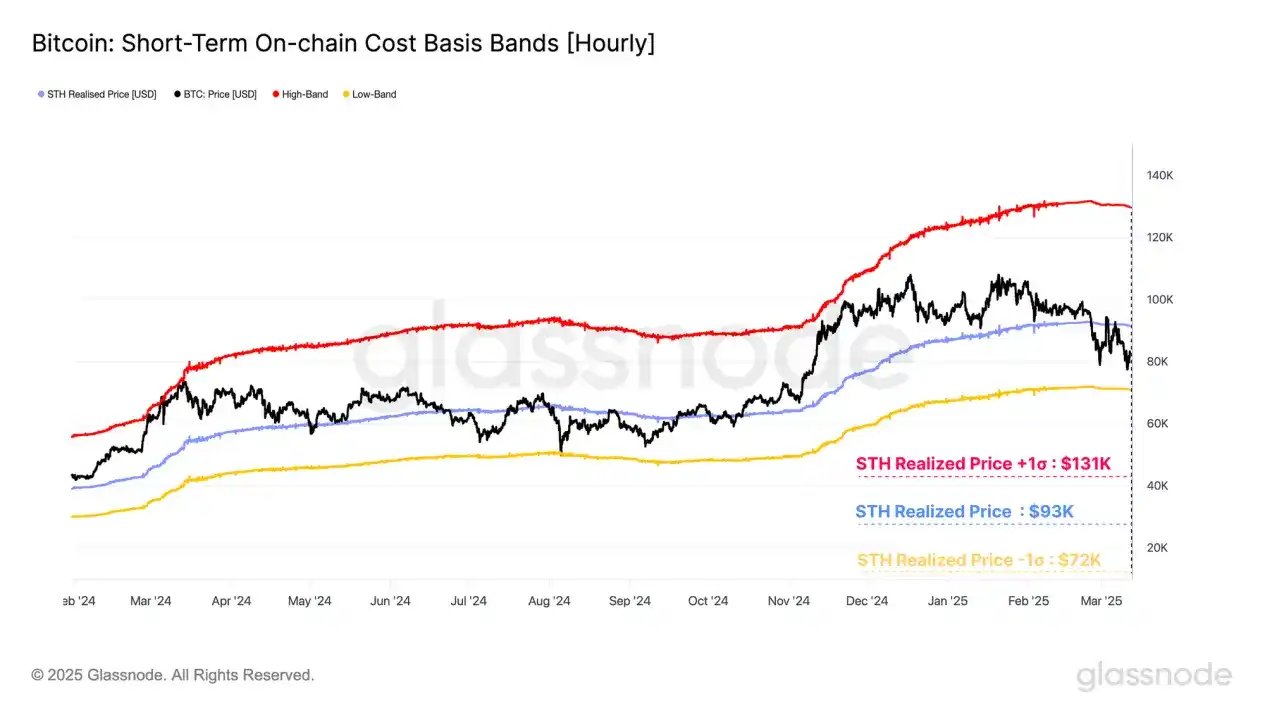
Short-term holders (STH) cost benchmarks have always been regarded as a key reference level for judging market momentum during a bull market. A ±1 standard deviation interval is constructed around this cost benchmark, which can usually be used as the upper and lower edges of local price fluctuations.
· Short-term holder cost benchmark +1σ: USD 131,000
· Short-term holder cost benchmark: $93,000
· Short-term holder cost benchmark -1σ: USD 72,000
Bitcoin’s first fall below the short-term holder cost benchmark (STH-CB) indicates that the market momentum begins to weaken (also falling below the 111-day moving average). The price then rebounded below the cost line and encountered resistance, confirming the turn of investor sentiment.
Currently, the Bitcoin spot price has stabilized between the STH cost benchmark and -1 standard deviation below it, forming the upper and lower boundaries of the current trading range, namely $93,000 to $72,000.
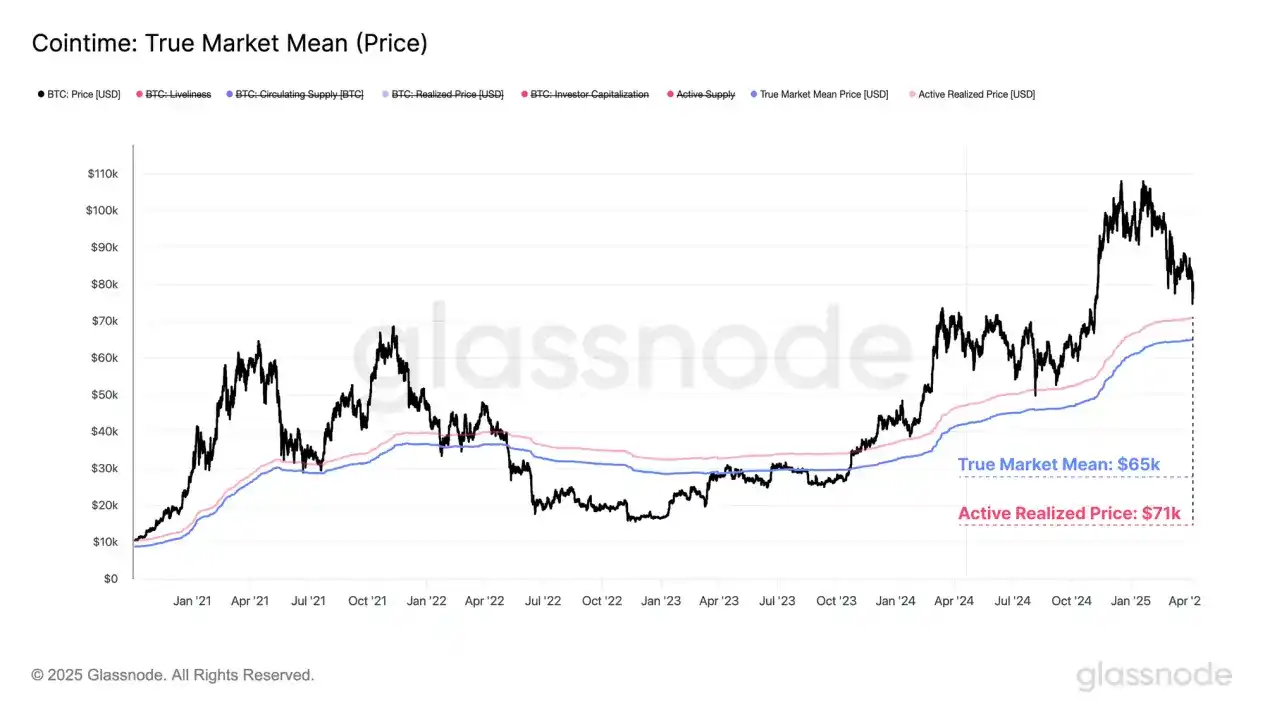
Active Realized Price and True Market Mean are another set of price models, usually near the center axis of the Bitcoin cycle. These two models estimate the cost basis for active participants in the market by removing lost or long-term unused supplies.
Statistically speaking, spot prices fluctuate above or below these two models in about 50% of trading days, so they can serve as important mean regression references and are used to divide the market state boundaries between bull and bear markets.
Active Realized Price: $71,000
True Market Mean: $65,000
Consensus of multiple on-chain price models suggests that the $65,000 range is a key area for bulls to build long-term support. If the price effectively falls below this range, it will mean that the vast majority of active investors are in a state of floating losses, and the overall market sentiment may be significantly hit.
in conclusion
Affected by the intensified uncertainty of US tariff policies, pressure on global financial markets continues to rise. This weakness has spread to almost all asset classes, as can be seen from the significant pullbacks in major macroindexes.
The digital asset market was not spared, and all sub-sectors overall showed a comprehensive contraction. Bitcoin price fell to $75,000 for a time, marking one of the largest drawdowns since the bull market began in January 2023. Ethereum has fallen even more severely, and many long-tail crypto assets are currently in a bear market trend.
Combined with a variety of on-chain and technical price models, the range of $65,000 to $71,000 is seen as a key area for long-term support for long-term reconstruction. If the price of Bitcoin falls below this range, market sentiment may suffer a major blow, as the majority of active investors' positions will be in a floating loss state.


No comments yet