Dogecoin (DOGE) crisis! Is it the Jedi counterattack to double the surge, or is it completely sinking? 100% Soaring may become a bubble!
Dogecoin is now retesting a key high time frame support level - channel lows. In past market conditions, this region has prompted a sharp bullish expansion of prices. Given that the current price structure is still downward, the market cannot help but ask: Will history repeat itself, and a strong rise will be triggered from this key trading position again?
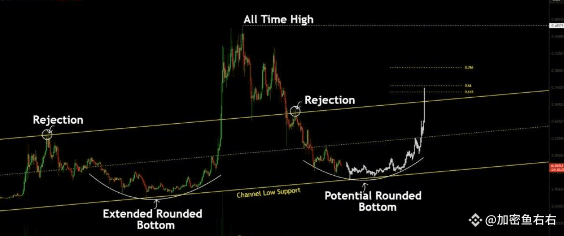
From a higher time frame perspective, Dogecoin's price trend is showing a similar structure as before the last big bullish expansion. Although the overall structure is still in a bearish trend, with highs and lows moving down step by step, the price has returned to the channel low support area with important historical significance. Previously, the support level had successfully withstood downward pressure and triggered a strong rebound. Now that prices are back here, traders are paying close attention to trying to capture whether similar rebound signals will appear again.
At present, although Dogecoin is in a bearish structure, testing the low support level of key channels has become the focus of the market. Historical experience shows that similar bottoms formed at this level often trigger a sharp rise. If there is a subsequent breakthrough and accompanied by an impulsive trading volume above the average level, the price of Dogecoin may usher in a violent fluctuation of more than 100%.
Since Dogecoin prices have returned to the years range, the trend has been mostly weak. Each rebound forms a higher high, followed by a lower low. This trend has made market sentiment continue to bearish and also hindered the bulls from making long-term layout. However, things will turn back, and such frustrating patterns often indicate the arrival of important bottoms, especially when they appear in proven support areas, such as the current channel lows.
Looking back at the last time Dogecoin tested the low point of this channel, it took a long time to form a round bottom pattern. The round bottom is a typical bottoming pattern, laying the foundation for subsequent strong reversals. In the end, driven by a large amount of trading volume and active market participation, the price broke through significantly. Now, prices are approaching the same area again. Although history will not be simply repeated, if prices can stand firm in this area and build a support structure, the possibility of similar bullish results will increase.
#DOGE