


Ethereum on-chain data and RSI suggest a possible trend reversal toward $1,690 despite a bearish streak and whale exits.
As the tariffs imposed by Donald Trump come into effect, the crypto market witnesses another spike in volatility. This caused Ethereum’s price to drop to a 24-hour low of $1,383. Currently, after a minor price rejection, Ethereum is trading at $1,461.
The increasing volatility has resulted in four consecutive bearish candles in Ethereum’s price trend, forming within a parallel channel. As the declining trend tests the crucial support trendline, will buyers manage to overturn the supply pressure for a sudden rebound?
Ethereum Price Analysis
Ethereum’s price trend continues within the falling channel pattern on the daily chart. Despite multiple lower-price rejection candles, Ethereum struggles to bounce off the local support trendline.
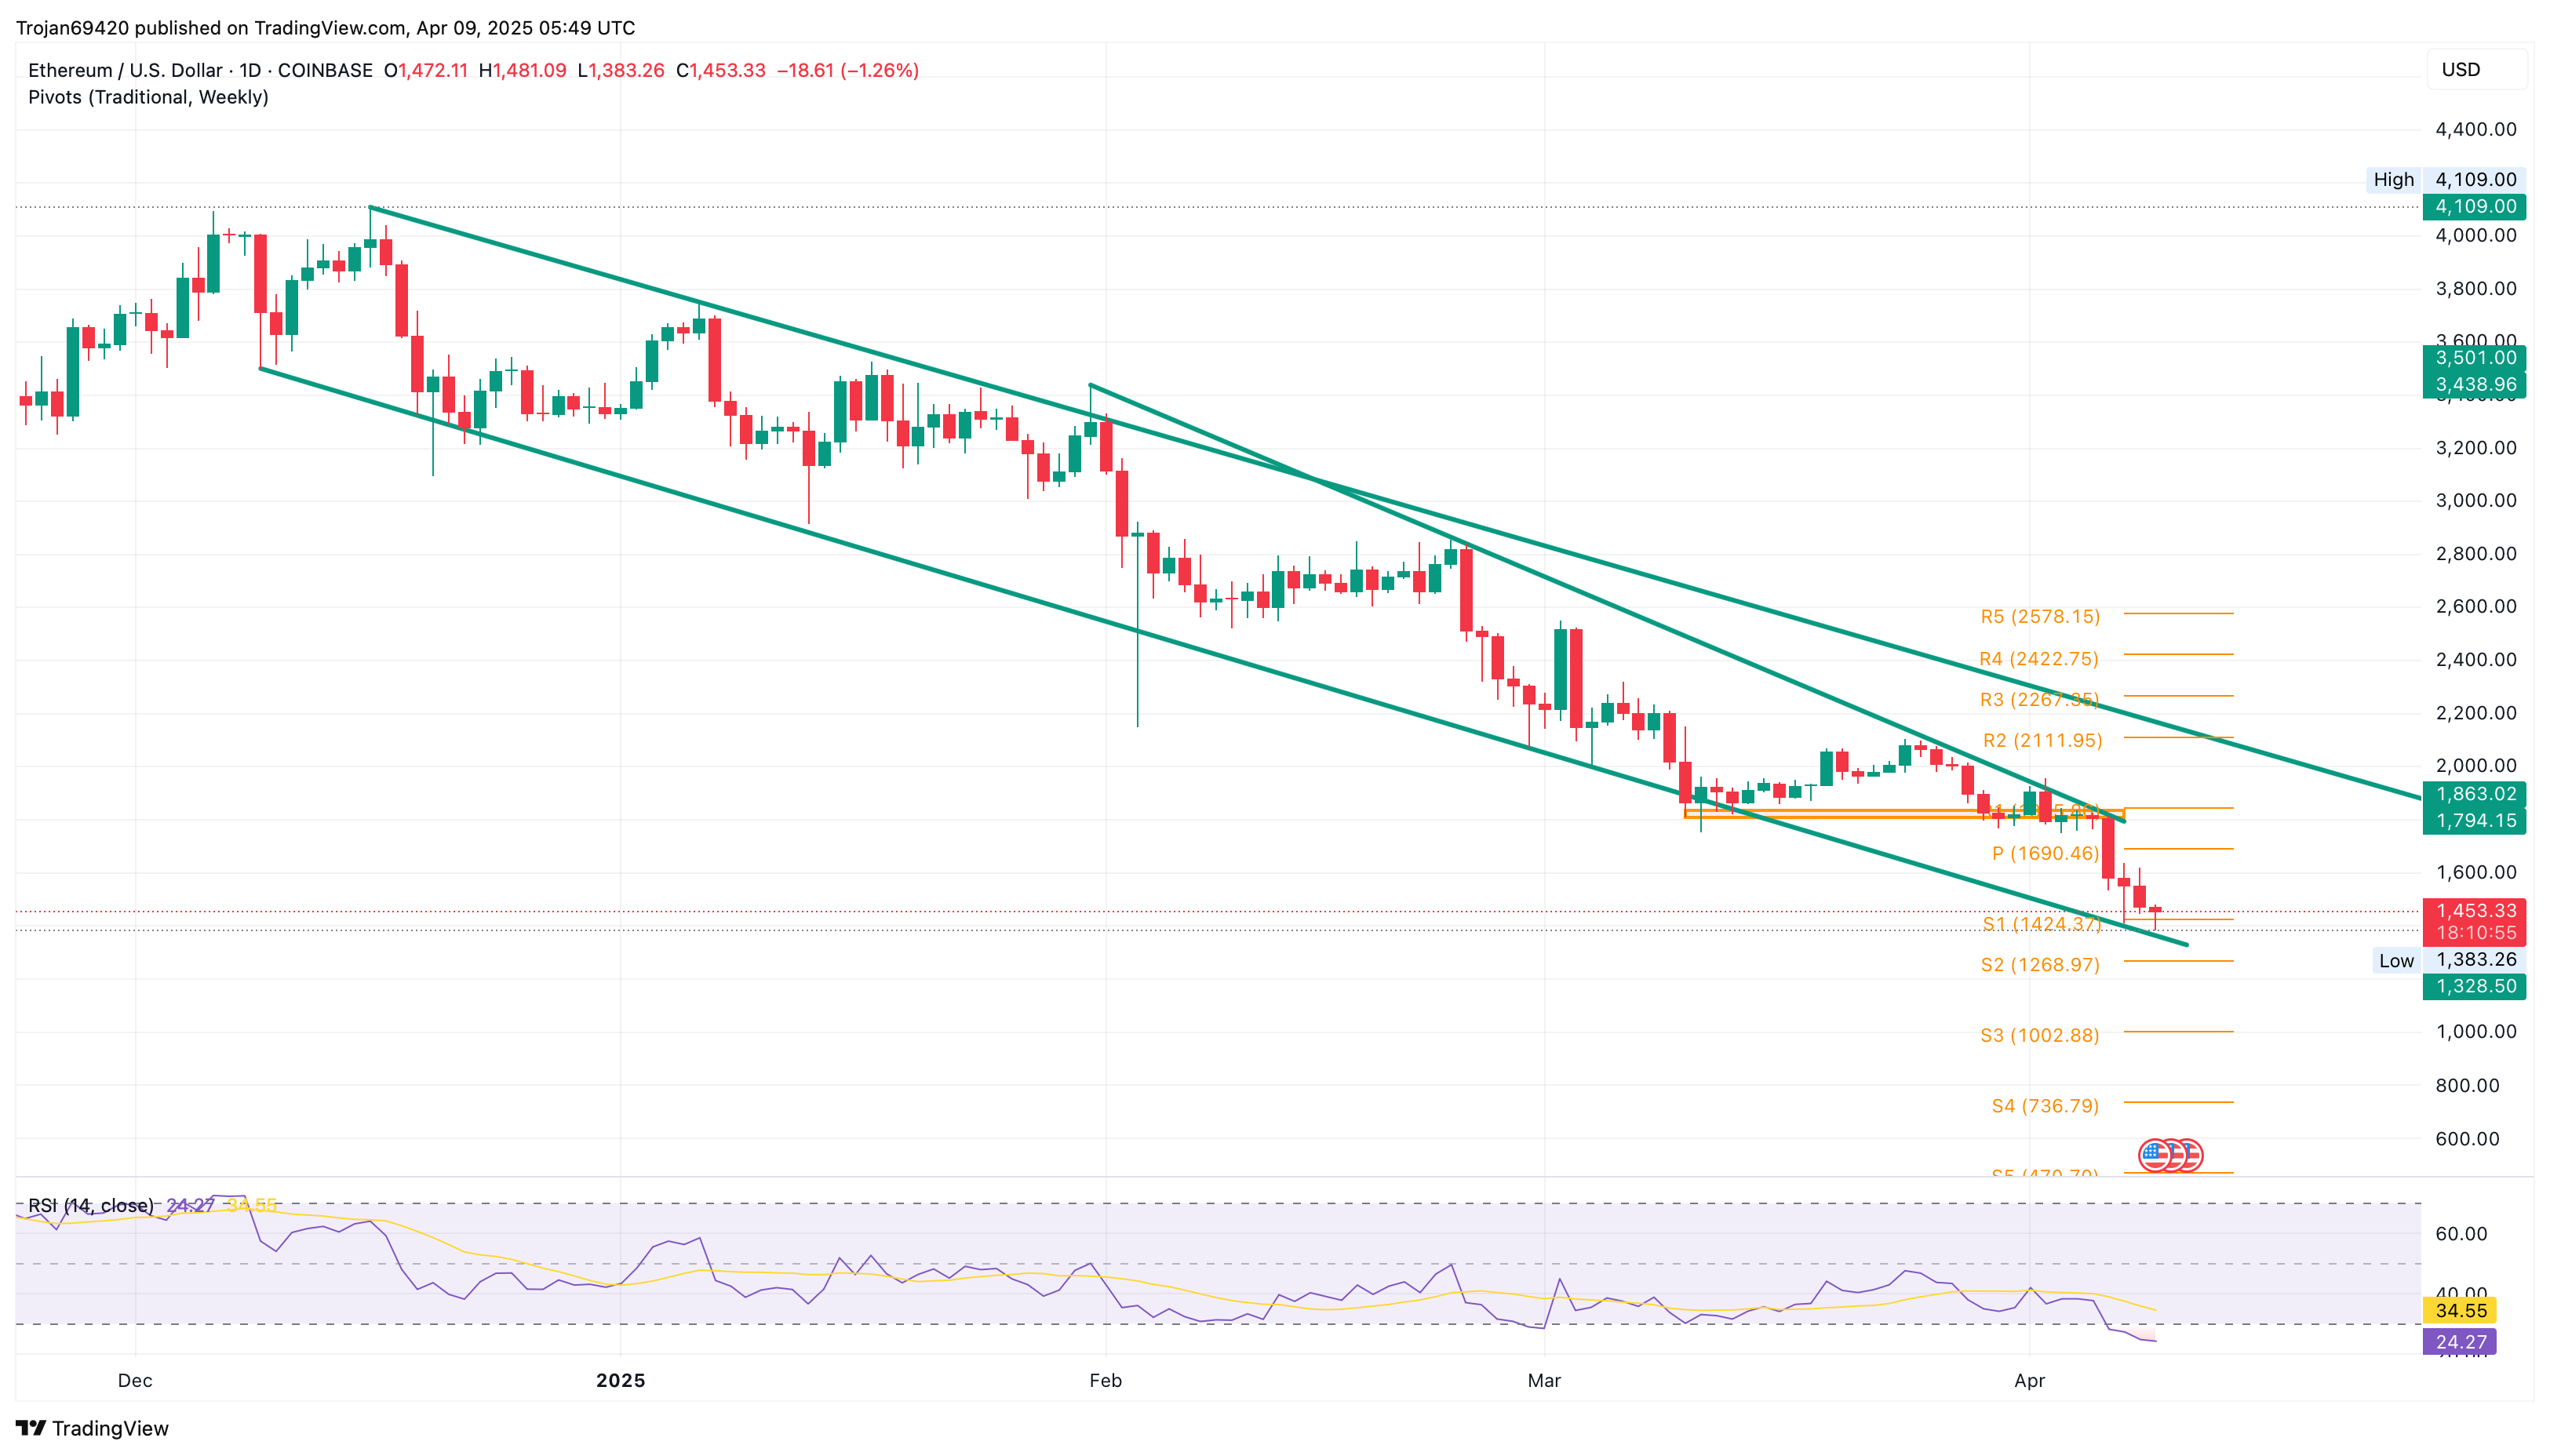
Despite the four consecutive bearish candles, underlying bullish support helps Ethereum stay above the S1 pivot support level at $1,424. Buyers anticipate a further crash for Ethereum as fear grows in the market.
However, the daily RSI has entered the oversold region, hinting at a potential minor relief rally. As Ethereum stands at a crucial crossroads at the base of the falling channel pattern, crypto whales are struggling to maintain confidence in Ethereum.
Whales on Selling Spree
Specifically, Donald Trump’s World Liberty Financial (WLFI) is allegedly booking profits in Ethereum. According to a recent tweet by LookOnChain, WLFI Trust has begun offloading ETH at a potential loss.
Based on data from Arkham, a wallet linked to the WLFI Trust has cashed out 5,471 ETH, worth $8.01 million, at an average price of $1,465.
WLFI previously spent $210 million to acquire nearly 67,500 ETH tokens. The average purchase price was $3,259, and they are currently recording an unrealized loss of $125 million.
Has Trump's World Liberty(@worldlibertyfi) started selling $ETH at a loss?
According to Arkham, a wallet possibly linked to #WorldLiberty sold 5,471 $ETH($8.01M) at $1,465 30 minutes ago.#WorldLiberty previously spent ~$210M to buy 67,498 $ETH at an average price of $3,259,… pic.twitter.com/jPMqCiADvt
— Lookonchain (@lookonchain) April 9, 2025
Furthermore, a crypto whale has dumped 500 ETH into the market after nearly two years of dormancy. After offloading $708,700 in ETH, the whale lost $166,000. The whale holds 1,725 ETH, worth $2.47M.
Historically, the whale withdrew 2,225 ETH, worth $3.34 million, from Bittrex between July 2022 and April 2023. Notably, the whale’s average purchase price of ETH was at $1,504.
Ethereum ETFs Maintain Outflowing Trend
Yesterday, the U.S. Ethereum Spot ETFs registered a total net outflow of $3.29 million, with Fidelity’s outflow accounting for the majority of the outflow. The other nine ETFs recorded zero flow. Ethereum ETFs have seen a net outflow over the past six weeks, indicating an offloading trend.
On-Chain Data Hints at Long-Term Bottom Formation
Despite the multiple bearish signals in the market, CryptoQuant suggests that Ethereum’s price is likely to see a comeback. According to the latest tweet from the on-chain platform, Ethereum’s price has dropped below its realized price. Historically, this negative crossover between Ethereum’s market price and realized price has often coincided with long-term bottom zones.
Ethereum Price Has Dropped Below Its Realized Price
“Past data shows that whenever ETH dips below its realized price, it often coincides with long-term bottom zones.” – By @theKriptolik pic.twitter.com/cVRgufkqlc
— CryptoQuant.com (@cryptoquant_com) April 8, 2025
Ethereum Network Activity
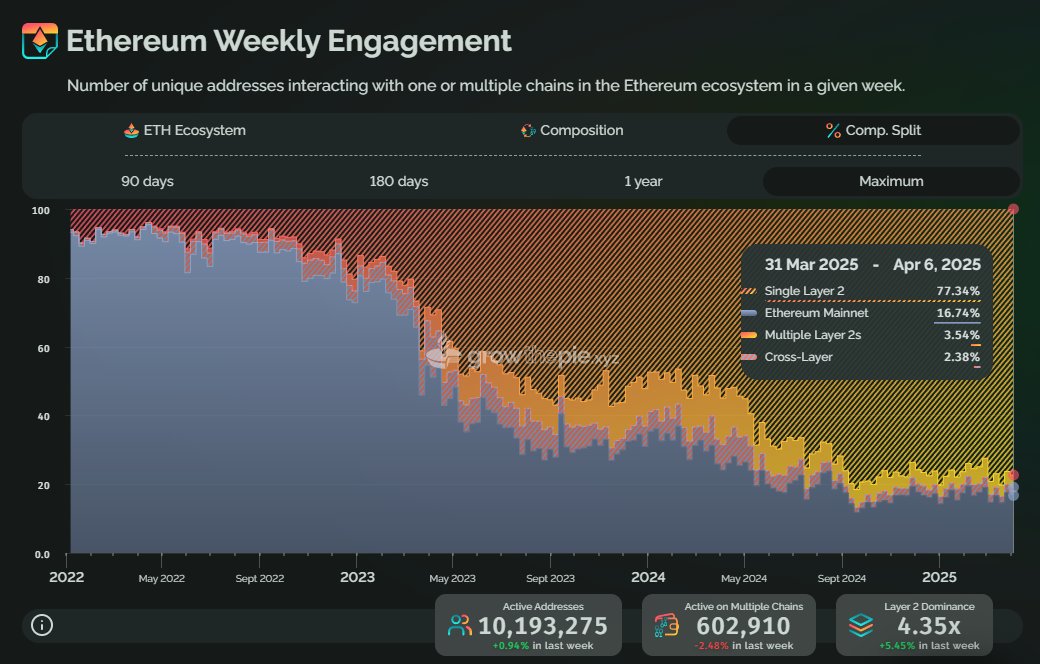
Amid increasing volatility, the Ethereum ecosystem remains optimistic. According to GrowThePie, active addresses on the Ethereum network have increased by 0.94% over the past week.
This brings the total number of active addresses to 10.19 million. Additionally, Ethereum’s Layer 2 dominance at 4.35x marks a 5.45% increase from the previous week.
As of April 6, activity on a single Layer 2 stood at 77%, with nearly 17% on the Ethereum mainnet. The remaining 4% was registered across multiple Layer 2s, and the rest (2%) was on cross-layers.
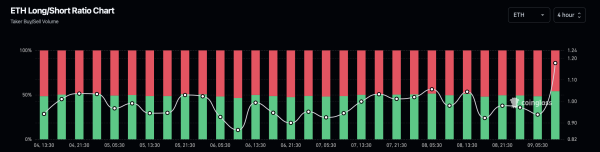
Meanwhile, futures contracts for Ethereum are seeing an increase in long positions. The long-to-short ratio chart shows that long positions now account for 54.09%, pushing the long-to-short ratio to 1.1782.
Furthermore, open interest at $17.46 billion has increased by 0.25%, indicating a gradual increase in trader activity. However, the funding rate remains at 0.0046%, showing a significant recovery from 0.0090%.
Ethereum Price Targets
Based on current price action and rising bullish sentiment in the derivatives market, a potential reversal could challenge the center pivot level at $1,690. The oversold RSI supports the possibility of a bullish turnaround.
However, declining confidence among large crypto whales could pose a risk of a sudden supply surge. In this case, a potential breakdown in Ethereum’s price may test the S3 pivot support level near the $1,000 psychological mark.


No comments yet